Geospatial Data Analysis with Python
Contents
Geospatial Data Analysis with Python#
Course material from the Winter 2024 offering of CEE467/CEWA567 (formerly CEE498/CEWA599) at the University of Washington
2024 Instructor: Eric Gagliano
Material created by David Shean
Civil and Environmental Engineering
University of Washington
Description#
This course explores geospatial data processing, analysis, interpretation, and visualization techniques using Python and open-source tools/libraries. Covers fundamental concepts, real-world data engineering problems, and data science applications using a variety of geospatial and remote sensing datasets.
Highlights#
Aspects of both data engineering and data science, with exploratory data analysis approach
Learn how to programatically answer real-world remote sensing and GIS questions (and how to ask new questions)
Query and process geospatial data on-the-fly, without manual downloads
Limited emphasis on machine learning, but some examples scattered throughout labs (e.g., K-means clustering)
Examples focus on Washington state and Western U.S., with applications in snow hydrology and other CEE disciplines
Samples#
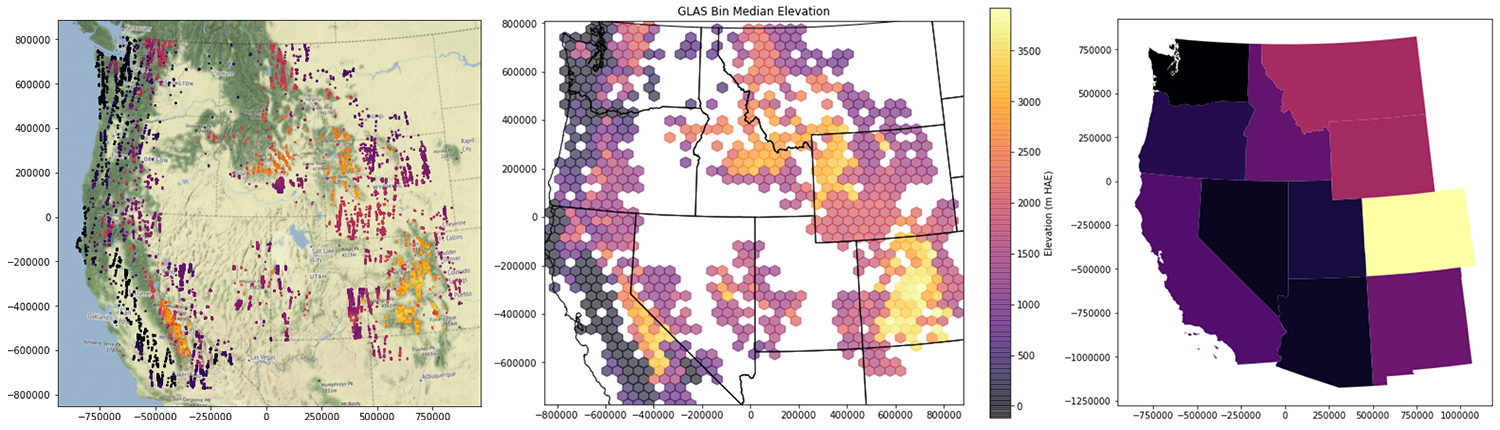
ICESat satellite laser altimetry data over Western U.S. (modules 3-4, 6)
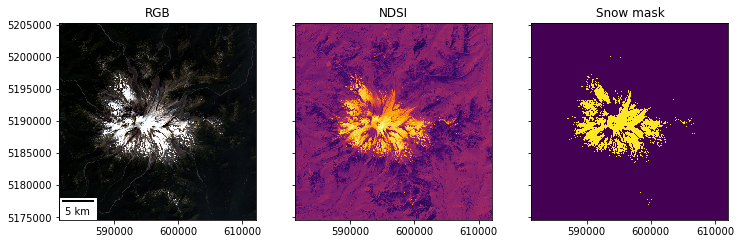
Estimating snow-covered area for Mt. Rainier from Landsat-8 multi-spectral satellite imagery (module 5)
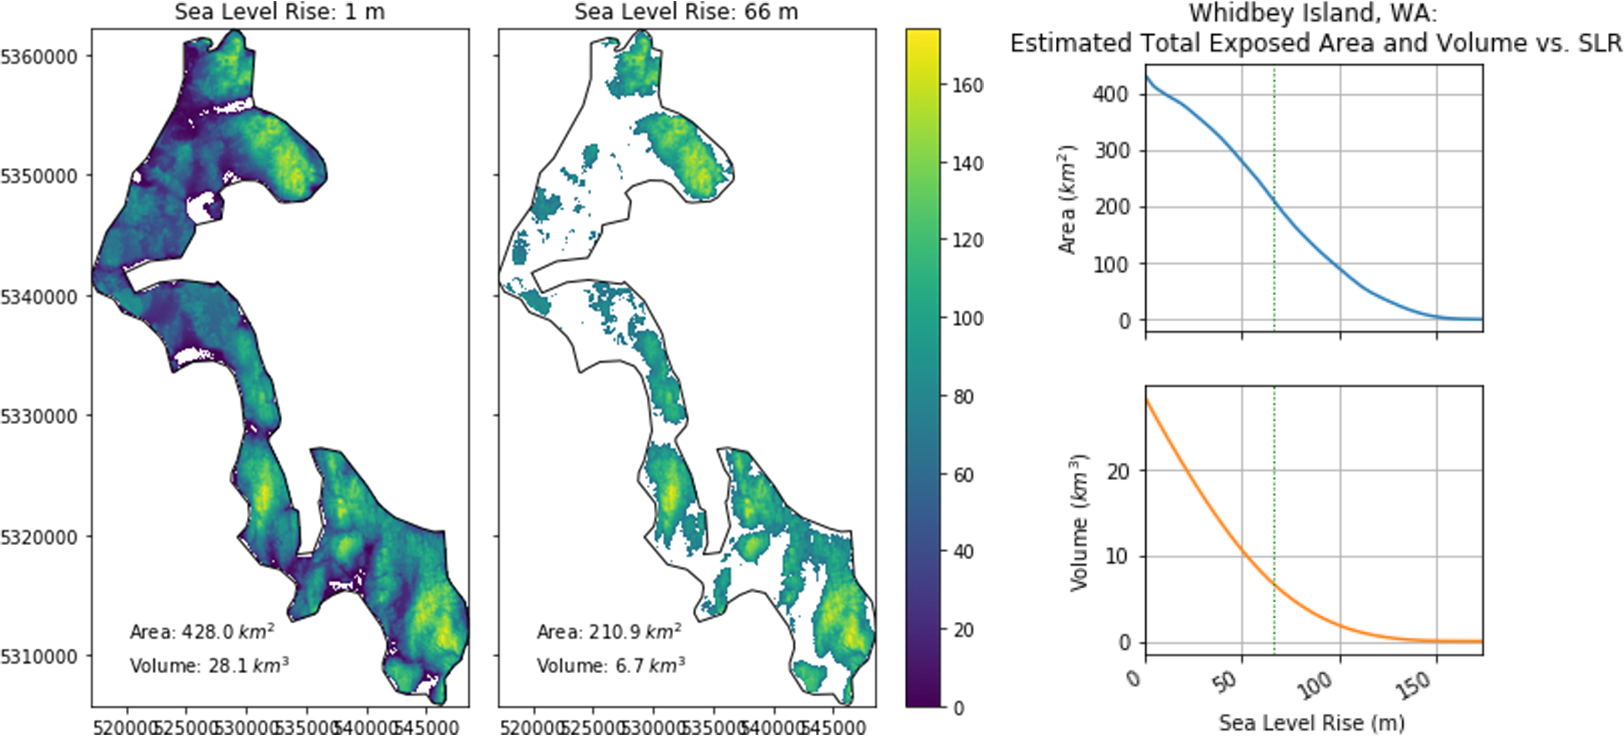
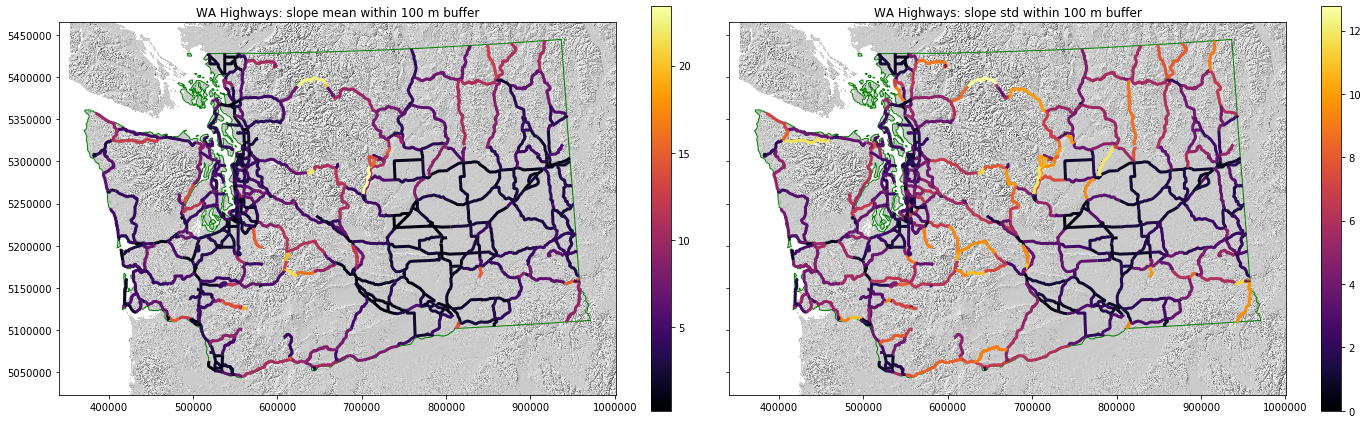
Raster DEM analysis to estimate impacts of sea level rise and hazards near WA highways (module 7)
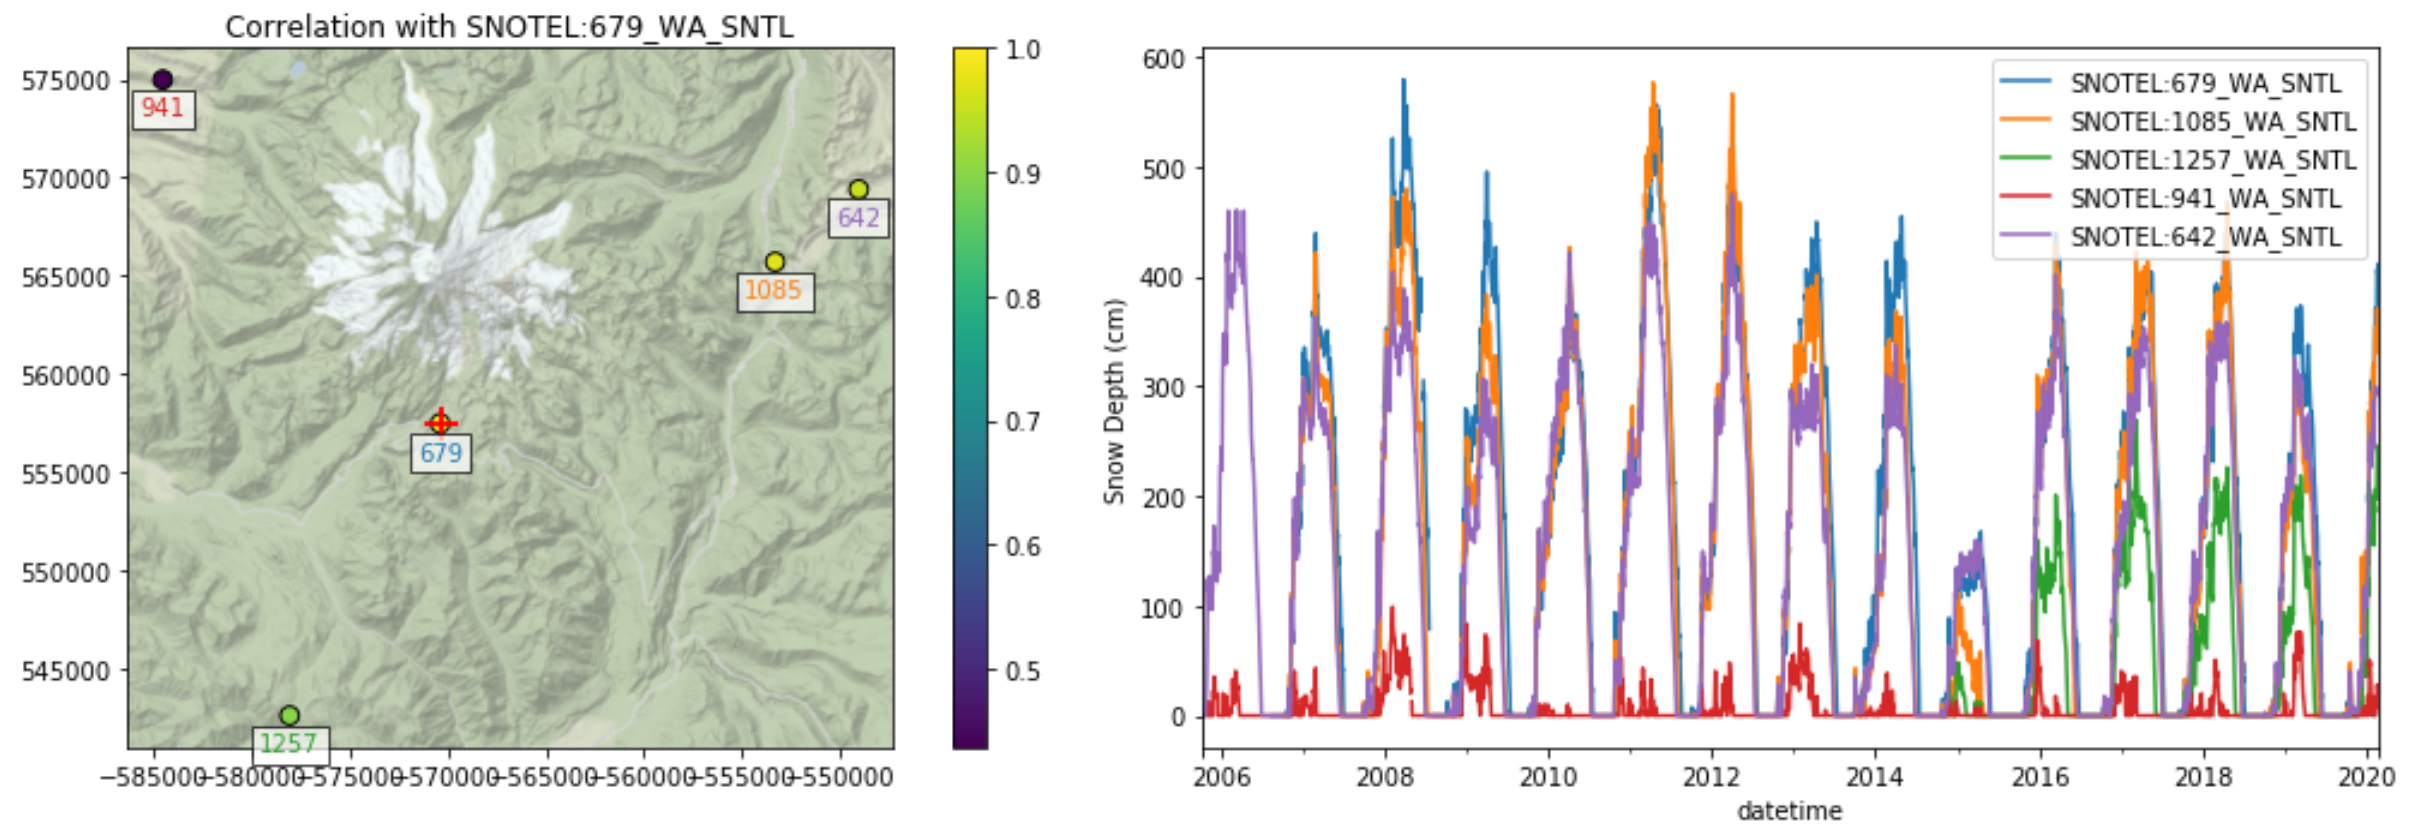
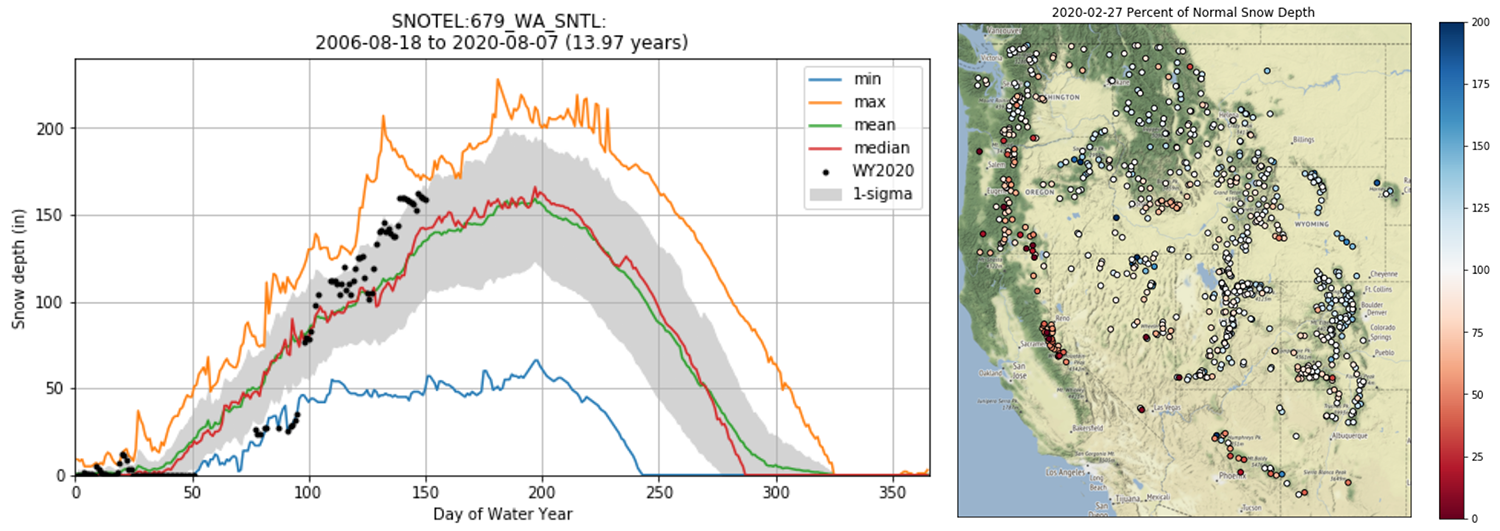
Western U.S. SNOTEL station analysis (module 8)
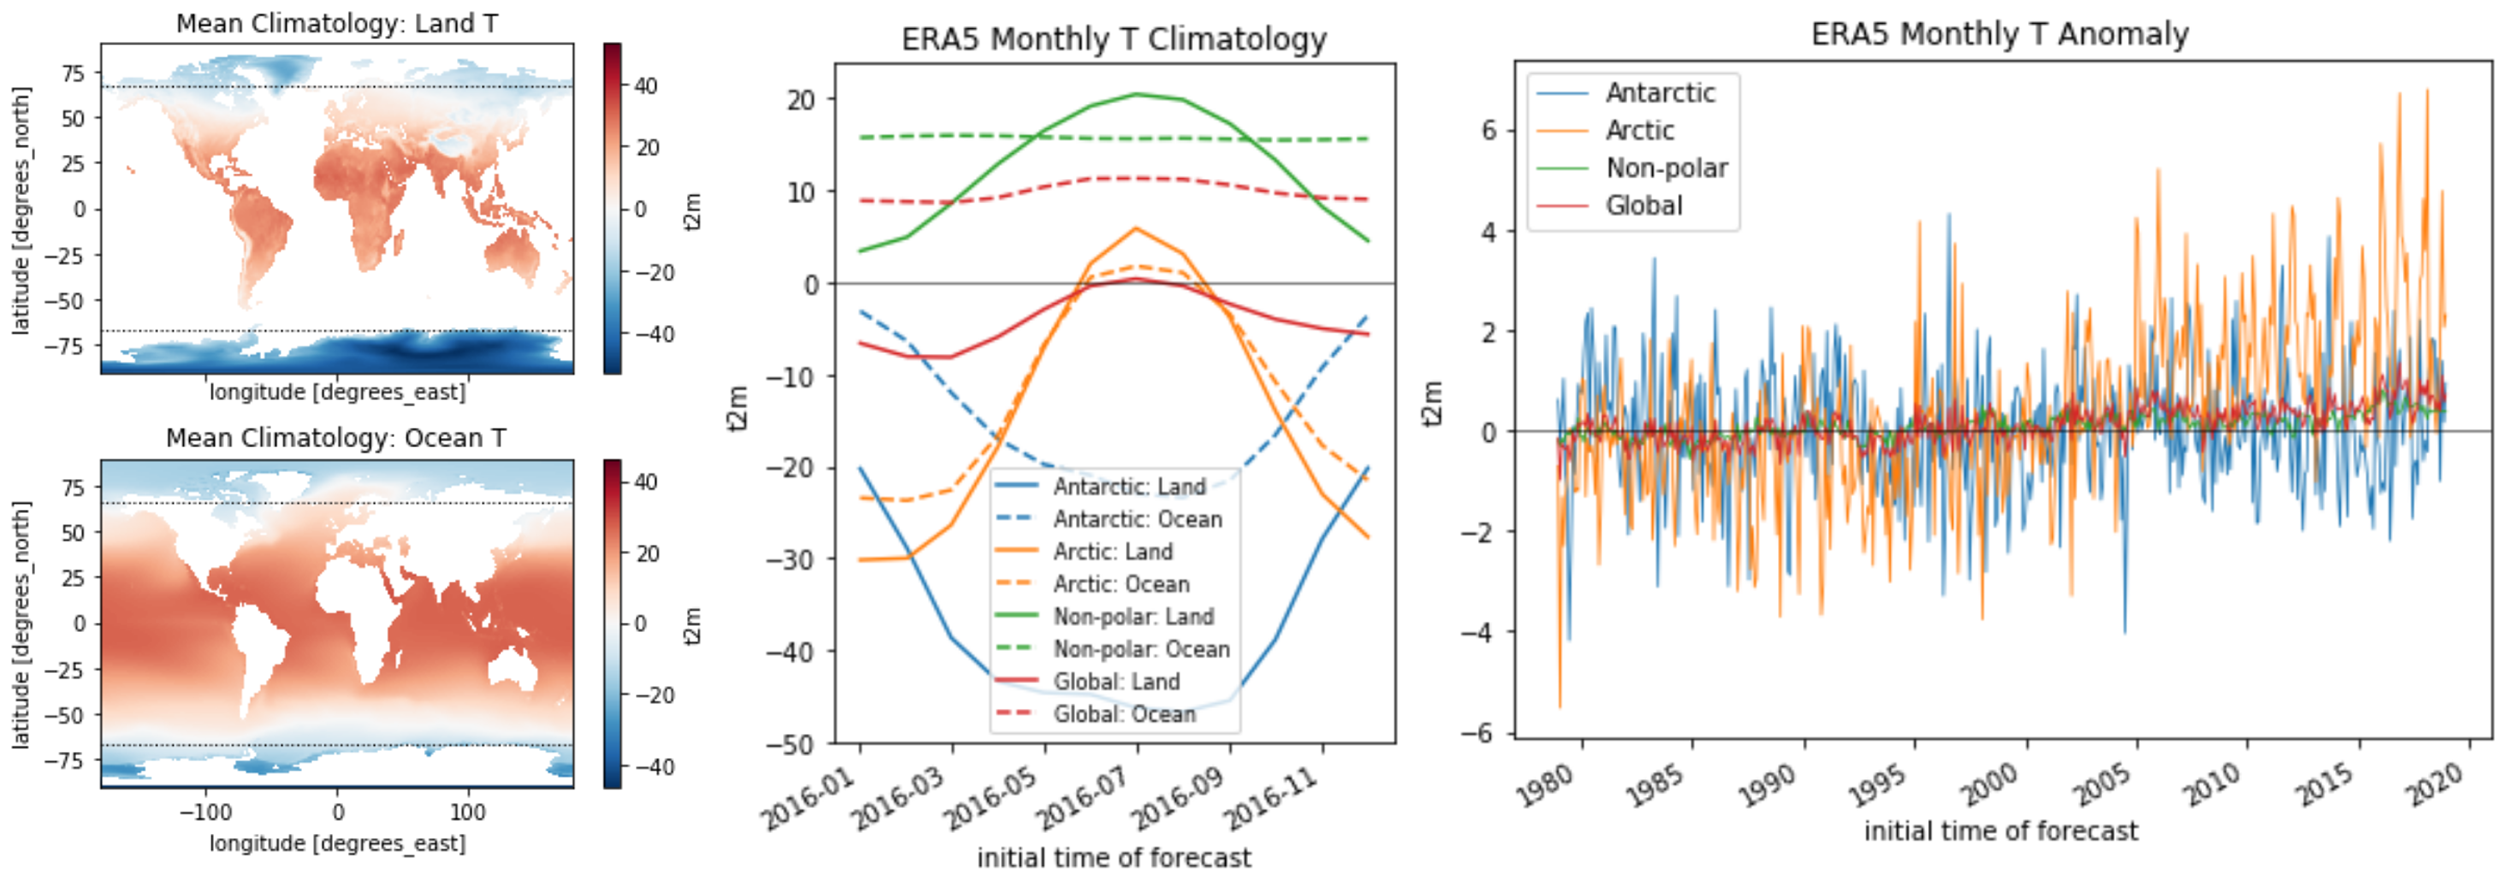
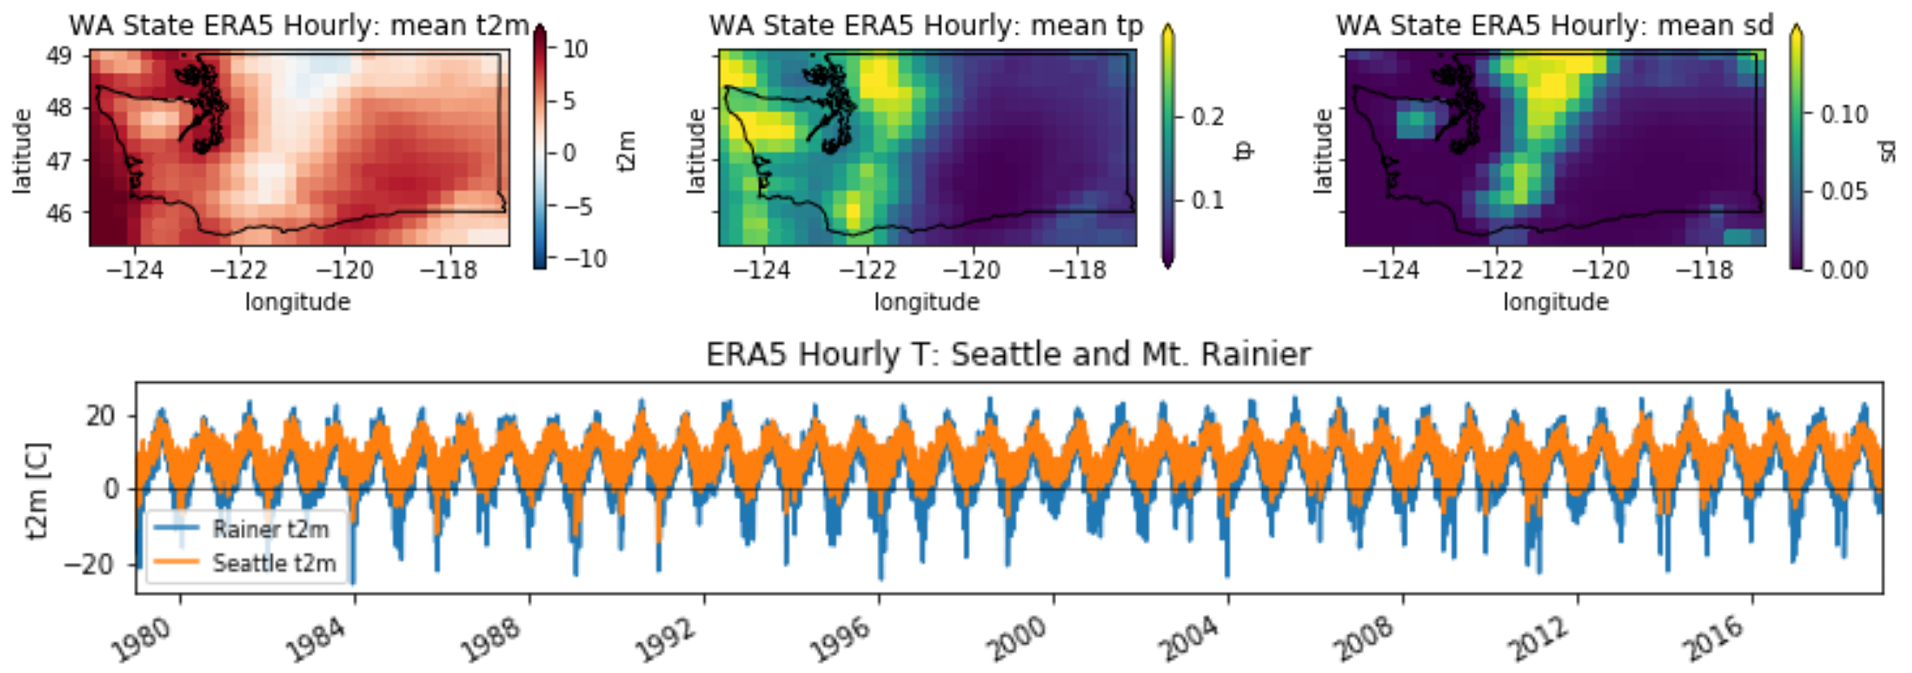
Global and regional climate reanalysis data (module 9)
Modules#
The course is organized into 10 week-long modules. Each module contains background reading assignments and Jupyter notebooks with introduction, demo, and lab exercises. The material builds on content and datasets from previous weeks.
Shell and git/Github
Python, iPython, Jupyter notebooks
Numpy, Pandas, Matplotlib
Vector 1: Geopandas, CRS, Projections
Raster 1: GDAL, rasterio, Landsat-8 satellite imagery
Vector 2: Geometries, Spatial Operations, Visualization
Raster 2: Warping, Clipping, Sampling, DEM Analysis
Vector time series, SNOTEL data
ND arrays, xarray, ERA5 climate reanalysis data
Conda, dask, rioxarray
Try it!#
![]() Clicking this badge will launch the GDA image and Jupyterlab environment on mybinder.org. This will provide the same environment that was available on the course Jupyterhub during winter 2024. You can use the file browser on the left side to navigate and launch interactive notebooks in the
Clicking this badge will launch the GDA image and Jupyterlab environment on mybinder.org. This will provide the same environment that was available on the course Jupyterhub during winter 2024. You can use the file browser on the left side to navigate and launch interactive notebooks in the book/modules directory.
Note: this session is ephemeral and the hardware resources may be limited (~2-8 GB of RAM, limited disk space). Your home directory will not persist, so use this only for exploration and demos. Within the Jupterylab environment, you can always right-click on a file and download locally if you want to preserve your changes, or use git/github!
Reproducing locally#
Download all course materials:
git clone https://github.com/UW-GDA/jupyterbookSee the Week 10 materials for instructions on how to set up your local environment to run the notebooks. Or, if you’re already familiar with conda, here are the environment files:
uwgda2023 (see the conda lock file for pinned version numbers)
Notebooks should have instructions/code to download all necessary data
Course details#
Syllabus (UW netid required)#
Student Preparation#
Follow the above link for answers to FAQ:
No formal prerequisites!?
Do I need to know Python?
What if I’m really comfortable with R/Matlab?
I’ve never used GIS before, is that a problem?
Weekly workflow#
Students independently complete online reading assignments or work through tutorials prior to lab
Synchronous 1.5-hour lecture/demo/discussion on Wednesday afternoon
Will be recorded for students who cannot attend synchronously
Synchronous 3-hour lab session on Friday afternoon
Initial 5-15 minutes for students to meet and discuss previous lab exercises without instructor
Next 15-30 minutes: logistics and some discussion around lingering questions/issues
Next 30-60 minutes: lab introduction and demo for new material
Will be recorded for students who cannot attend synchronously
Remainder of lab for groups of students to work through lab materials, discuss, write code, troubleshoot, and try to complete exercises together
Students finish exercises (and “extra credit” challenge problems) for homework (due the following week). Students report ~6-12 hours outside of the 3-hour lab required to complete reading and homework
See weekly workflow document in Resources section for additional information
Final Project#
Students propose, refine, perform and present independent or group projects
Final deliverables: Github repository and ~10 minute presentation
Resources for students#
Intended for students enrolled in the full course at the University of Washington
Additional resources for students attempting independent self-study, or those who are attempting individual modules rather than the full 10-week course (see syllabus for additional thoughts on philosophy and time commitment).
Resources for instructors#
Intended for me, TAs and others who will be teaching similar material (or using similar approaches).
If you find this content useful, please consider contributing upstream corrections, modifications, and/or suggestions.
Solutions#
The notebooks in this public repo are the “student” versions, with many empty cells and instructions for lab exercises. The completed notebooks with my solutions are archived in a private solutions repo. Enrolled students receive access to this repo after submitting their own solutions to the lab exercises each week. I have not released the solutions publicly, as I expect future students enrolled in the course to learn “the hard way” as they work through the problems on their own. If you have independently tried to work through these notebooks and would like to compare your answers, I can potentially add you as a collaborator.
I wish that I had a better approach for distribution, as I know that these solutions to be a useful resource for those who can’t dedicate weeks to learn the material. My priority right now is to preserve the learning experience for enrolled students, and to be able to reuse similar material in the coming years (developing these notebooks requires a considerable amount of time). I am open to suggestions on strategies that will enable students to “unlock” the solutions as they incrementally make progress.
Contributions#
If you find errors or have suggestions for improvements, please consider creating a Github Issue or submitting a Pull Request. I view the development of this material as an open, collaborative effort. I expect to teach this course in the coming years, and will continue refining/updating. I sincerely appreciate any help that I can get on this and I will acknowledge your contributions (see below)!
Disclaimer#
The primary objective of this course is to teach geospatial analysis concepts and to provide interesting problems to engage students as they learn how to use modern, open-source tools. Several examples make simplifying assumptions and/or use older datasets for analysis. There are more rigorous ways to approach all of these problems, and I encourage you to consult the peer-reviewed literature for more information or any official purposes. Also, the tools and methods outlined here will work for many problems, but may not always be suitable for very large datasets that require more efficient, distributed computing. I hope to integrate more of this in the future, but for now the focus remains on relatively small problems, as it’s easy to get lost in the details of scaling.
Acknowledgements#
Many individuals have contributed to the content and infrastructure development required for this course:
First and foremost, the brave GDA students who enrolled in this course duing winter 2019 and winter 2020 provided critical feedback, suggestions and often elegant solutions to challenging problems
Scott Henderson (UW eScience/ESS) for leading the Jupyterhub image preparation, JupyterBook, and Github CI setup and configuration
Chris Land (UW-IT) and Scott Henderson (UW eScience/ESS) provided Jupyterhub configuration and support during the 2020 UW-IT Jupyterhub Pilot offering
Amanda Tan (UW eScience) provided Jupyterhub configuration and support during 2019
Bill Schaefer, Tom Lewis and Rob Fatland (UW-IT) provided management and support for the UW-IT Jupyterhub program
Friedrich Knuth, Shashank Bhushan, and Michelle Hu provided assistance during lab periods in 2020. Friedrich Knuth provided initial material on conda.
Anthony Arendt and the UW eScience Hackweek leadership team for providing a foundation and resources for interactive education and software development
License#

The content of this repository is licensed under a Creative Commons Attribution-ShareAlike 4.0 International License, and the embedded source code is licensed under the MIT license.
Citation#
If you use content or code in a publication, please cite as:
Shean, D. (2023), Geospatial Data Analysis with Python: Course material from the Winter 2023 offering at the University of Washington (CEE467/CEWA567), Zenodo, http://doi.org/10.5281/zenodo.3978778
If you learn from this material, or you use some of this material in a different course, please show your support by clicking the “Star” button in upper right corner of the repo page. Thanks!