09 Demo: Multidimensional (N-d) arrays, xarray, ERA5 climate reanalysis data
Contents
09 Demo: Multidimensional (N-d) arrays, xarray, ERA5 climate reanalysis data#
UW Geospatial Data Analysis
CEE467/CEWA567
David Shean
Introduction#
This week we are going to do some basic analysis of climate reanalysis data. This could be useful for some of your projects, especially if considering time series data.
We will use a few different products from the state-of-the-art global ERA5 reanalysis, which currently span 1950-present with hourly timestep at up to a 9 km resolution.
We will use xarray to open, combine, analyze and plot the data.
xarray#
Take a moment to review this high-level introduction:
“xarray (formerly xray) is an open source project and Python package that makes working with labelled multi-dimensional arrays simple, efficient, and fun!
Xarray introduces labels in the form of dimensions, coordinates and attributes on top of raw NumPy-like arrays, which allows for a more intuitive, more concise, and less error-prone developer experience. The package includes a large and growing library of domain-agnostic functions for advanced analytics and visualization with these data structures.
Xarray is inspired by and borrows heavily from pandas, the popular data analysis package focused on labelled tabular data. It is particularly tailored to working with netCDF files, which were the source of xarray’s data model, and integrates tightly with dask for parallel computing.”
Remember back to Lab03, when you tried to extract a column of elevation values from a 2D NumPy array, with something like myarray[:,4]? And then how much easier it was to do the same thing with a labeled pandas DataFrame mydf['glas_z']? Same deal here, just extended beyond 2D.
Why?
Excellent choice for working with large datasets, as it uses lazy evaluation and parallel processing with Dask: http://xarray.pydata.org/en/stable/dask.html
Lots of great tutorials and resources: https://xarray.pydata.org/en/stable/tutorials-and-videos.html
Big user community
Some feel it should be the defacto Python data science object: https://xarray.pydata.org/en/stable/getting-started-guide/why-xarray.html#goals-and-aspirations
Why not?
General means complicated
Steep learning curve, esp for new users unfamiliar with Pandas
Sometimes overkill for simple problems
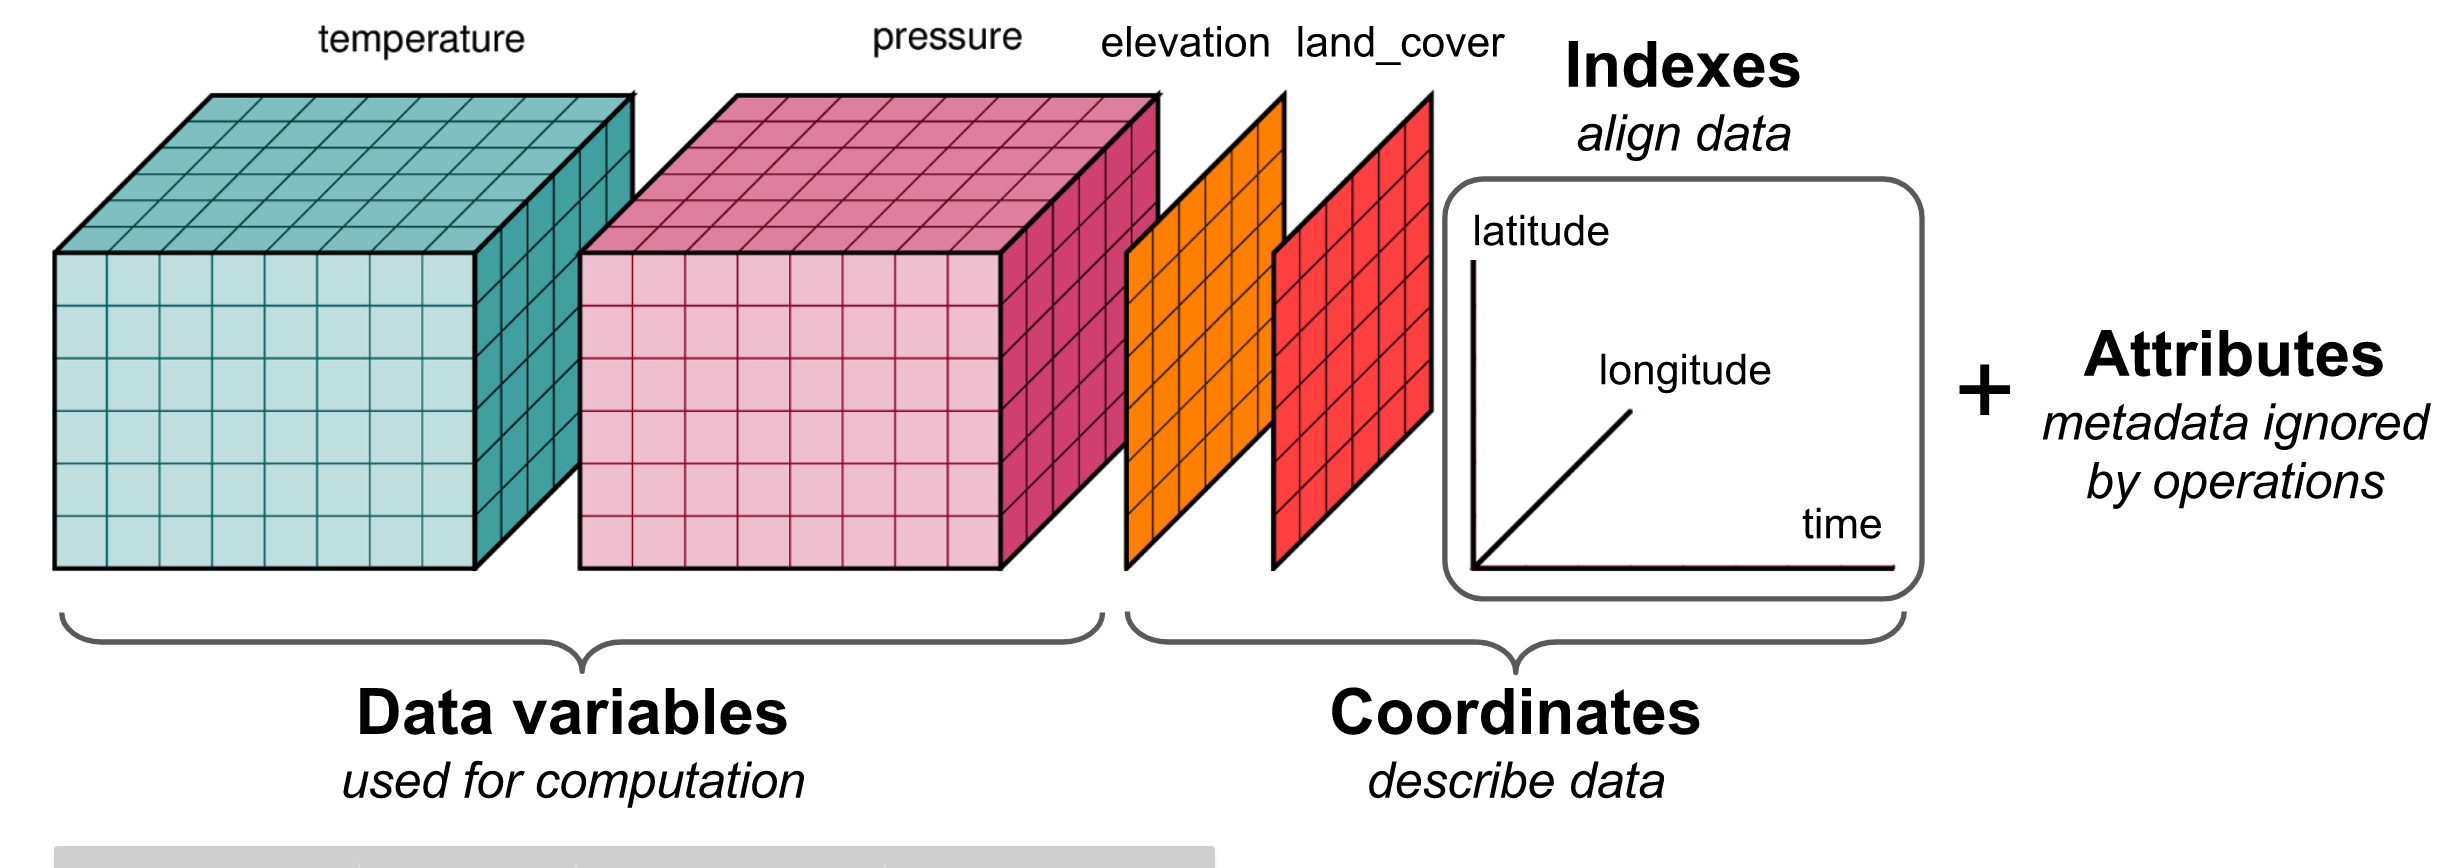
xarray data model overview#
So, what’s an nD array? (https://numpy.org/doc/stable/reference/arrays.ndarray.html). You’ve been using them all quarter, but mostly 1D and 2D NumPy arrays.
As with many of the packages we’ve covered this quarter, vocabulary can be one of the biggest blocks to learning. Let’s discuss.
 (http://xarray.pydata.org/en/latest/data-structures.html#dataset)
Comparison with Pandas#
Pandas is very good at handling 2D tabular datasets (e.g., csv with columns and rows, time series of met station variables from a single station [T, precip, etc]) or a single variable across multiple stations.
“If your data fits nicely into a pandas DataFrame then you’re better off using one of the more developed tools there.” (https://xarray.pydata.org/en/latest/user-guide/plotting.html)
“pandas excels at working with tabular data. That suffices for many statistical analyses, but physical scientists rely on N-dimensional arrays – which is where xarray comes in.” (http://xarray.pydata.org/en/stable/why-xarray.html#goals-and-aspirations)
xarray extends the Pandas functionality to support 3+ dimensions (e.g., time series of 2D rasters).
xarray is to Pandas…#
xarray DataArray : Pandas DataSeries
xarray DataSet : Pandas DataFrame
Terminology#
https://xarray.pydata.org/en/stable/user-guide/terminology.html
https://xarray.pydata.org/en/latest/user-guide/data-structures.html#data-structures
DataArray#
Four essential pieces:
values: a numpy.ndarrays with actual data values (e.g., (‘2-m air temperature (t2m)’, ‘Total precipitation (tp)’)dims: dimension names for each axis (e.g., (‘lon’, ‘lat’, ‘time’))coords: a dict-like container of arrays that label each value in each dimension (e.g., 1-D array of x coordinates, 1-D array of y coordiantes, datetime objects or strings)attrs: an OrderedDict containing additional metadata (attributes)
Why do we need both dims and coords?#
“Dimensions provide names that xarray uses instead of the axis argument found in many numpy functions. Coordinates enable fast label based indexing and alignment, building on the functionality of the index found on a pandas DataFrame or Series.”
Dataset#
Essentially, a collection of DataArrays (like a dictionary of DataArrays)
http://xarray.pydata.org/en/latest/data-structures.html#dataset
Notes:
One value in one of the contained arrays (say a single temperature measurement) usually has multiple coordinates (‘lon’, ‘lat’, ‘time’)
Useful xarray examples and references#
Indexing and selection: https://xarray.pydata.org/en/stable/user-guide/indexing.html
Plotting: https://xarray.pydata.org/en/stable/user-guide/plotting.html
Visualization examples: http://xarray.pydata.org/en/stable/examples/visualization_gallery.html
Time-series analysis: https://xarray.pydata.org/en/stable/user-guide/time-series.html
netCDF format#
Much of the xarray design and functionality is derived from the NetCDF project:
“NetCDF (Network Common Data Form) is a set of software libraries and machine-independent data formats that support the creation, access, and sharing of array-oriented scientific data. It is also a community standard for sharing scientific data.” https://www.unidata.ucar.edu/software/netcdf/
“Data in netCDF format is:
Self-Describing. A netCDF file includes information about the data it contains.
Portable. A netCDF file can be accessed by computers with different ways of storing integers, characters, and floating-point numbers.
Scalable. Small subsets of large datasets in various formats may be accessed efficiently through netCDF interfaces, even from remote servers.
Appendable. Data may be appended to a properly structured netCDF file without copying the dataset or redefining its structure.
Sharable. One writer and multiple readers may simultaneously access the same netCDF file.
Archivable. Access to all earlier forms of netCDF data will be supported by current and future versions of the software.”
“Commonly used in climatology, meteorology and oceanography applications (e.g., weather forecasting, climate change) and GIS applications.” https://en.wikipedia.org/wiki/NetCDF
import xarray as xr
import os
import geopandas as gpd
import pandas as pd
import numpy as np
import matplotlib.pyplot as plt
Demo: Create simple DataArray#
from numpy.random import RandomState
prng = RandomState(1234567890)
#data = np.random.rand(4, 3)
#Use fixed instance of random state to reduce diff as notebook is modified in future years
data = prng.rand(4, 3)
data
array([[0.61879477, 0.59162363, 0.88868359],
       [0.8916548 , 0.45756748, 0.77818808],
       [0.26706377, 0.99610621, 0.54009489],
       [0.53752161, 0.40099938, 0.70540579]])
#xr.DataArray?
xr.DataArray(data)
<xarray.DataArray (dim_0: 4, dim_1: 3)>
array([[0.61879477, 0.59162363, 0.88868359],
       [0.8916548 , 0.45756748, 0.77818808],
       [0.26706377, 0.99610621, 0.54009489],
       [0.53752161, 0.40099938, 0.70540579]])
Dimensions without coordinates: dim_0, dim_1locs = ["WA", "OR", "CA"]
times = pd.date_range("2000-01-01", periods=4)
times
DatetimeIndex(['2000-01-01', '2000-01-02', '2000-01-03', '2000-01-04'], dtype='datetime64[ns]', freq='D')
foo = xr.DataArray(data, coords=[times, locs], dims=["time", "space"])
foo
<xarray.DataArray (time: 4, space: 3)>
array([[0.61879477, 0.59162363, 0.88868359],
       [0.8916548 , 0.45756748, 0.77818808],
       [0.26706377, 0.99610621, 0.54009489],
       [0.53752161, 0.40099938, 0.70540579]])
Coordinates:
* time (time) datetime64[ns] 2000-01-01 2000-01-02 2000-01-03 2000-01-04
* space (space) <U2 'WA' 'OR' 'CA'Indexing#
foo.values
array([[0.61879477, 0.59162363, 0.88868359],
       [0.8916548 , 0.45756748, 0.77818808],
       [0.26706377, 0.99610621, 0.54009489],
       [0.53752161, 0.40099938, 0.70540579]])
foo.shape
(4, 3)
foo[0,0]
<xarray.DataArray ()>
array(0.61879477)
Coordinates:
    time     datetime64[ns] 2000-01-01
space <U2 'WA'foo[0, :]
<xarray.DataArray (space: 3)>
array([0.61879477, 0.59162363, 0.88868359])
Coordinates:
    time     datetime64[ns] 2000-01-01
* space (space) <U2 'WA' 'OR' 'CA'foo.loc['2000-01-03']
<xarray.DataArray (space: 3)>
array([0.26706377, 0.99610621, 0.54009489])
Coordinates:
    time     datetime64[ns] 2000-01-03
* space (space) <U2 'WA' 'OR' 'CA'foo.loc[:,'WA']
<xarray.DataArray (time: 4)>
array([0.61879477, 0.8916548 , 0.26706377, 0.53752161])
Coordinates:
  * time     (time) datetime64[ns] 2000-01-01 2000-01-02 2000-01-03 2000-01-04
space <U2 'WA'#This doesn't work
#foo.loc['WA', '2000-01-03']
#Axis order matters!
#foo.loc['2000-01-03', 'WA']
foo.sel(time='2000-01-03', space='WA')
<xarray.DataArray ()>
array(0.26706377)
Coordinates:
    time     datetime64[ns] 2000-01-03
space <U2 'WA'foo.sel(space='WA', time='2000-01-03')
<xarray.DataArray ()>
array(0.26706377)
Coordinates:
    time     datetime64[ns] 2000-01-03
space <U2 'WA'foo.sel(space=['WA','OR'], time='2000-01-03')
<xarray.DataArray (space: 2)>
array([0.26706377, 0.99610621])
Coordinates:
    time     datetime64[ns] 2000-01-03
* space (space) <U2 'WA' 'OR'#No iloc, but can select based on integer index
foo.isel(time=3, space=1)
<xarray.DataArray ()>
array(0.40099938)
Coordinates:
    time     datetime64[ns] 2000-01-04
space <U2 'OR'Demo: Create xarray DataSet from SNOTEL data#
snotel_datadir = '../08_Vector_TimeSeries_SNOTEL/snotel_data'
#SNOTEL sites (with lat/lon coordiantes) for CONUS
sites_fn = os.path.join(snotel_datadir, 'snotel_conus_sites.json')
#singlesite_pkl_fn = 'SNOTEL-SNWD_D_679_WA_SNTL.pkl'
#Snow depth DataFrame for CONUS sites
allsites_SNWD_pkl_fn = os.path.join(snotel_datadir, 'SNOTEL-SNWD_D_CONUS_all.pkl')
#Snow water equivalent DataFrame for WA
allsites_WTEQ_pkl_fn = os.path.join(snotel_datadir, 'SNOTEL-WTEQ_D_WA.pkl')
sites_gdf_all = gpd.read_file(sites_fn).set_index('index')
allsites_snwd_df = pd.read_pickle(allsites_SNWD_pkl_fn).dropna(axis=0, how='all')
allsites_wteq_df = pd.read_pickle(allsites_WTEQ_pkl_fn).dropna(axis=0, how='all')
sites_gdf_all.head()
| code | name | network | elevation_m | county | state | pos_accuracy_m | beginDate | endDate | HUC | HUD | TimeZone | actonId | shefId | stationTriplet | isActive | HUC2 | HUC6 | geometry | |
|---|---|---|---|---|---|---|---|---|---|---|---|---|---|---|---|---|---|---|---|
| index | |||||||||||||||||||
| SNOTEL:301_CA_SNTL | 301_CA_SNTL | Adin Mtn | SNOTEL | 1886.712036 | Modoc | California | 0 | 10/1/1983 12:00:00 AM | 1/1/2100 12:00:00 AM | 180200021403 | 18020002 | -8.0 | 20H13S | ADMC1 | 301:CA:SNTL | True | 18 | 180200 | POINT (-120.79192 41.23583) |
| SNOTEL:907_UT_SNTL | 907_UT_SNTL | Agua Canyon | SNOTEL | 2712.719971 | Kane | Utah | 0 | 10/1/1994 12:00:00 AM | 1/1/2100 12:00:00 AM | 160300020301 | 16030002 | -8.0 | 12M26S | AGUU1 | 907:UT:SNTL | True | 16 | 160300 | POINT (-112.27118 37.52217) |
| SNOTEL:916_MT_SNTL | 916_MT_SNTL | Albro Lake | SNOTEL | 2529.840088 | Madison | Montana | 0 | 9/1/1996 12:00:00 AM | 1/1/2100 12:00:00 AM | 100200050701 | 10020005 | -8.0 | 11D28S | ABRM8 | 916:MT:SNTL | True | 10 | 100200 | POINT (-111.95902 45.59723) |
| SNOTEL:908_WA_SNTL | 908_WA_SNTL | Alpine Meadows | SNOTEL | 1066.800049 | King | Washington | 0 | 9/1/1994 12:00:00 AM | 1/1/2100 12:00:00 AM | 171100100501 | 17110010 | -8.0 | 21B48S | APSW1 | 908:WA:SNTL | True | 17 | 171100 | POINT (-121.69847 47.77957) |
| SNOTEL:302_OR_SNTL | 302_OR_SNTL | Aneroid Lake #2 | SNOTEL | 2255.520020 | Wallowa | Oregon | 0 | 10/1/1980 12:00:00 AM | 1/1/2100 12:00:00 AM | 170601050101 | 17060105 | -8.0 | 17D02S | ANRO3 | 302:OR:SNTL | True | 17 | 170601 | POINT (-117.19258 45.21328) |
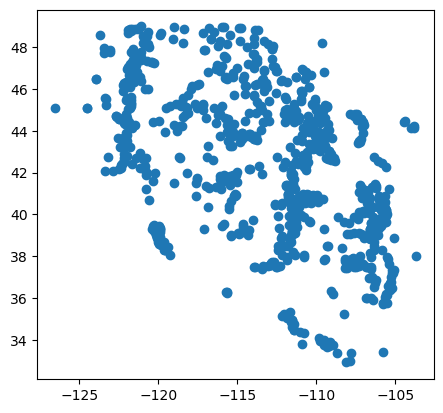
sites_gdf_all.plot();
allsites_snwd_df.tail()
| SNOTEL:301_CA_SNTL | SNOTEL:907_UT_SNTL | SNOTEL:916_MT_SNTL | SNOTEL:908_WA_SNTL | SNOTEL:302_OR_SNTL | SNOTEL:1000_OR_SNTL | SNOTEL:303_CO_SNTL | SNOTEL:1030_CO_SNTL | SNOTEL:304_OR_SNTL | SNOTEL:306_ID_SNTL | ... | SNOTEL:872_WY_SNTL | SNOTEL:873_OR_SNTL | SNOTEL:874_CO_SNTL | SNOTEL:875_WY_SNTL | SNOTEL:876_MT_SNTL | SNOTEL:877_AZ_SNTL | SNOTEL:1228_UT_SNTL | SNOTEL:1197_UT_SNTL | SNOTEL:878_WY_SNTL | SNOTEL:1033_CO_SNTL | |
|---|---|---|---|---|---|---|---|---|---|---|---|---|---|---|---|---|---|---|---|---|---|
| datetime | |||||||||||||||||||||
| 2023-02-19 00:00:00+00:00 | 42.0 | 33.0 | 48.0 | 78.0 | 55.0 | 76.0 | 8.0 | 60.0 | 44.0 | 68.0 | ... | 27.0 | 48.0 | 88.0 | 29.0 | 25.0 | 26.0 | 39.0 | 37.0 | 35.0 | 63.0 |
| 2023-02-20 00:00:00+00:00 | 41.0 | 32.0 | 47.0 | 84.0 | 56.0 | 75.0 | 8.0 | 62.0 | 44.0 | 70.0 | ... | 28.0 | 49.0 | 88.0 | 33.0 | 26.0 | 24.0 | 39.0 | 36.0 | 37.0 | 68.0 |
| 2023-02-21 00:00:00+00:00 | 40.0 | 31.0 | 46.0 | 86.0 | 55.0 | 73.0 | 10.0 | 61.0 | 43.0 | 71.0 | ... | 29.0 | 48.0 | 86.0 | 42.0 | 33.0 | 21.0 | 39.0 | 35.0 | 42.0 | 68.0 |
| 2023-02-22 00:00:00+00:00 | 40.0 | 32.0 | 53.0 | NaN | 56.0 | 83.0 | 6.0 | NaN | 51.0 | 76.0 | ... | 39.0 | 52.0 | 86.0 | 45.0 | 35.0 | 19.0 | 44.0 | 34.0 | 46.0 | 70.0 |
| 2023-02-23 00:00:00+00:00 | 44.0 | 38.0 | 52.0 | 91.0 | 56.0 | 90.0 | 8.0 | 67.0 | 52.0 | 78.0 | ... | NaN | 57.0 | 98.0 | 44.0 | 33.0 | 23.0 | 45.0 | 41.0 | 45.0 | 73.0 |
5 rows × 806 columns
allsites_wteq_df.tail()
| SNOTEL:908_WA_SNTL | SNOTEL:990_WA_SNTL | SNOTEL:352_WA_SNTL | SNOTEL:1080_WA_SNTL | SNOTEL:1107_WA_SNTL | SNOTEL:375_WA_SNTL | SNOTEL:376_WA_SNTL | SNOTEL:942_WA_SNTL | SNOTEL:1109_WA_SNTL | SNOTEL:1085_WA_SNTL | ... | SNOTEL:1012_WA_SNTL | SNOTEL:817_WA_SNTL | SNOTEL:899_WA_SNTL | SNOTEL:824_WA_SNTL | SNOTEL:1171_WA_SNTL | SNOTEL:832_WA_SNTL | SNOTEL:841_WA_SNTL | SNOTEL:974_WA_SNTL | SNOTEL:909_WA_SNTL | SNOTEL:863_WA_SNTL | |
|---|---|---|---|---|---|---|---|---|---|---|---|---|---|---|---|---|---|---|---|---|---|
| datetime | |||||||||||||||||||||
| 2023-02-21 00:00:00+00:00 | 38.1 | 24.6 | 9.8 | 40.0 | 33.3 | 16.4 | 16.3 | 16.6 | 0.2 | 36.9 | ... | 61.5 | 22.2 | 22.8 | 24.1 | 24.2 | 12.1 | 9.2 | 20.1 | 24.7 | 17.2 |
| 2023-02-22 00:00:00+00:00 | 37.7 | 24.8 | 10.2 | 40.5 | 34.2 | 16.7 | 16.9 | 16.4 | 1.1 | 37.2 | ... | 62.9 | 22.2 | 23.6 | 24.4 | 24.3 | 12.1 | 9.4 | 20.9 | 25.3 | 17.8 |
| 2023-02-23 00:00:00+00:00 | 37.5 | 24.6 | 10.4 | 40.4 | 34.3 | 16.7 | 16.9 | 16.7 | 1.5 | 37.0 | ... | 63.6 | 22.2 | 23.5 | 24.2 | 24.2 | 12.4 | 10.1 | 21.0 | 25.3 | 17.9 |
| 2023-02-24 00:00:00+00:00 | 37.6 | 24.4 | 10.4 | 40.2 | 34.2 | 16.7 | 16.7 | 16.3 | 1.6 | 37.0 | ... | 63.5 | 22.0 | 23.5 | 24.1 | 24.1 | 12.4 | 10.2 | 20.9 | 25.2 | 17.8 |
| 2023-02-25 00:00:00+00:00 | 37.8 | 24.5 | 10.4 | 40.3 | 34.3 | 16.7 | 16.7 | 16.5 | 1.6 | 37.2 | ... | 63.5 | 22.1 | 23.4 | 24.3 | 24.1 | 12.6 | 10.4 | 21.0 | 25.4 | 17.8 |
5 rows × 74 columns
Note difference in number of records and columns#
Some stations have one but not the other
WTEQ extends farther back in time
Convert to xarray DataArrays#
Sometimes
to_xarray()just worksWe have a GeoDataFrame with locations, and then two separate DataFrames with timestamps and values
#Doesn't quite work for our sites
#sites_gdf_all.to_xarray()
#Doesn't quite work for our time series
#allsites_snwd_df.to_xarray()
#Function to prepare xarray DataArray for SNOTEL sites and time series
def get_DataArray(df, sites, name="SNWD_D"):
    valid_sites = sites.loc[df.columns]

    site_id = valid_sites.index.values
    lon = valid_sites.geometry.x.values
    lat = valid_sites.geometry.y.values
    elev = valid_sites.elevation_m.values
    site_name = valid_sites.name.values

    #da = xr.DataArray(df, dims=("time", "site_id"), name=name)
    da = xr.DataArray(df, dims=("time", "site_id"), coords=(df.index.values, site_id), name=name)
    #For some reason, the times are not read as datetime64 objects, so reassign
    da["time"] = df.index.values
    da = da.assign_coords(lon=("site_id", lon), lat=("site_id", lat), elev=("site_id", elev))
    return da
snwd_da = get_DataArray(allsites_snwd_df, sites_gdf_all, name="SNWD_D")
snwd_da
<xarray.DataArray 'SNWD_D' (time: 10807, site_id: 806)>
array([[nan, nan, nan, ..., nan, nan, nan],
       [nan, nan, nan, ..., nan, nan, nan],
       [nan, nan, nan, ..., nan, nan, nan],
       ...,
       [40., 31., 46., ..., 35., 42., 68.],
       [40., 32., 53., ..., 34., 46., 70.],
       [44., 38., 52., ..., 41., 45., 73.]])
Coordinates:
  * time     (time) datetime64[ns] 1984-10-01 1984-10-02 ... 2023-02-23
  * site_id  (site_id) object 'SNOTEL:301_CA_SNTL' ... 'SNOTEL:1033_CO_SNTL'
    lon      (site_id) float64 -120.8 -112.3 -112.0 ... -112.8 -109.8 -106.6
    lat      (site_id) float64 41.24 37.52 45.6 47.78 ... 37.75 43.93 40.79
elev (site_id) float64 1.887e+03 2.713e+03 ... 2.545e+03 2.847e+03Add some attributes#
snwd_da.attrs['description'] = 'SNOTEL snow depth measurements (SNWD_D)'
snwd_da.attrs['units'] = 'inches'
snwd_da
<xarray.DataArray 'SNWD_D' (time: 10807, site_id: 806)>
array([[nan, nan, nan, ..., nan, nan, nan],
       [nan, nan, nan, ..., nan, nan, nan],
       [nan, nan, nan, ..., nan, nan, nan],
       ...,
       [40., 31., 46., ..., 35., 42., 68.],
       [40., 32., 53., ..., 34., 46., 70.],
       [44., 38., 52., ..., 41., 45., 73.]])
Coordinates:
* time (time) datetime64[ns] 1984-10-01 1984-10-02 ... 2023-02-23
* site_id (site_id) object 'SNOTEL:301_CA_SNTL' ... 'SNOTEL:1033_CO_SNTL'
lon (site_id) float64 -120.8 -112.3 -112.0 ... -112.8 -109.8 -106.6
lat (site_id) float64 41.24 37.52 45.6 47.78 ... 37.75 43.93 40.79
elev (site_id) float64 1.887e+03 2.713e+03 ... 2.545e+03 2.847e+03
Attributes:
description: SNOTEL snow depth measurements (SNWD_D)
units: inches#Prepare a separate Data Array for the WTEQ_D data
wteq_da = get_DataArray(allsites_wteq_df, sites_gdf_all, name="WTEQ_D")
wteq_da
<xarray.DataArray 'WTEQ_D' (time: 16219, site_id: 74)>
array([[ nan,  nan,  nan, ...,  nan,  nan,  nan],
       [ nan,  nan,  nan, ...,  nan,  nan,  nan],
       [ nan,  nan,  nan, ...,  nan,  nan,  nan],
       ...,
       [37.5, 24.6, 10.4, ..., 21. , 25.3, 17.9],
       [37.6, 24.4, 10.4, ..., 20.9, 25.2, 17.8],
       [37.8, 24.5, 10.4, ..., 21. , 25.4, 17.8]])
Coordinates:
  * time     (time) datetime64[ns] 1978-10-01 1978-10-02 ... 2023-02-25
  * site_id  (site_id) object 'SNOTEL:908_WA_SNTL' ... 'SNOTEL:863_WA_SNTL'
    lon      (site_id) float64 -121.7 -121.3 -120.7 ... -123.4 -121.8 -121.4
    lat      (site_id) float64 47.78 48.88 47.35 48.93 ... 47.94 48.87 46.64
elev (site_id) float64 1.067e+03 1.106e+03 ... 1.228e+03 1.353e+03wteq_da.attrs['description'] = 'SNOTEL snow water equivalent measurements (WTEQ_D)'
wteq_da.attrs['units'] = 'inches w.e.'
wteq_da
<xarray.DataArray 'WTEQ_D' (time: 16219, site_id: 74)>
array([[ nan,  nan,  nan, ...,  nan,  nan,  nan],
       [ nan,  nan,  nan, ...,  nan,  nan,  nan],
       [ nan,  nan,  nan, ...,  nan,  nan,  nan],
       ...,
       [37.5, 24.6, 10.4, ..., 21. , 25.3, 17.9],
       [37.6, 24.4, 10.4, ..., 20.9, 25.2, 17.8],
       [37.8, 24.5, 10.4, ..., 21. , 25.4, 17.8]])
Coordinates:
* time (time) datetime64[ns] 1978-10-01 1978-10-02 ... 2023-02-25
* site_id (site_id) object 'SNOTEL:908_WA_SNTL' ... 'SNOTEL:863_WA_SNTL'
lon (site_id) float64 -121.7 -121.3 -120.7 ... -123.4 -121.8 -121.4
lat (site_id) float64 47.78 48.88 47.35 48.93 ... 47.94 48.87 46.64
elev (site_id) float64 1.067e+03 1.106e+03 ... 1.228e+03 1.353e+03
Attributes:
description: SNOTEL snow water equivalent measurements (WTEQ_D)
units: inches w.e.Merge the two DataArrays into a single DataSet#
ds = xr.merge([snwd_da, wteq_da])
ds
<xarray.Dataset>
Dimensions:  (time: 16219, site_id: 806)
Coordinates:
  * time     (time) datetime64[ns] 1978-10-01 1978-10-02 ... 2023-02-25
  * site_id  (site_id) object 'SNOTEL:1000_OR_SNTL' ... 'SNOTEL:999_WA_SNTL'
    lon      (site_id) float64 -122.2 -105.4 -116.9 ... -110.8 -121.4 -121.7
    lat      (site_id) float64 42.87 37.61 40.36 46.91 ... 40.89 48.86 48.76
    elev     (site_id) float64 1.832e+03 3.246e+03 ... 1.606e+03 1.073e+03
Data variables:
    SNWD_D   (time, site_id) float64 nan nan nan nan nan ... nan nan nan nan nan
    WTEQ_D   (time, site_id) float64 nan nan nan nan nan ... nan nan 61.9 39.1
Attributes:
    description:  SNOTEL snow depth measurements (SNWD_D)
units: inches#Clear the attributes for the DataSet (preserved in the DataArrays)
ds.attrs = {}
ds
<xarray.Dataset>
Dimensions: (time: 16219, site_id: 806)
Coordinates:
* time (time) datetime64[ns] 1978-10-01 1978-10-02 ... 2023-02-25
* site_id (site_id) object 'SNOTEL:1000_OR_SNTL' ... 'SNOTEL:999_WA_SNTL'
lon (site_id) float64 -122.2 -105.4 -116.9 ... -110.8 -121.4 -121.7
lat (site_id) float64 42.87 37.61 40.36 46.91 ... 40.89 48.86 48.76
elev (site_id) float64 1.832e+03 3.246e+03 ... 1.606e+03 1.073e+03
Data variables:
SNWD_D (time, site_id) float64 nan nan nan nan nan ... nan nan nan nan nan
WTEQ_D (time, site_id) float64 nan nan nan nan nan ... nan nan 61.9 39.1#Access one variable (note dimensiond and coordinates)
ds['SNWD_D']
<xarray.DataArray 'SNWD_D' (time: 16219, site_id: 806)>
array([[ nan,  nan,  nan, ...,  nan,  nan,  nan],
       [ nan,  nan,  nan, ...,  nan,  nan,  nan],
       [ nan,  nan,  nan, ...,  nan,  nan,  nan],
       ...,
       [ 90.,  25.,  56., ...,  43., 127., 101.],
       [ nan,  nan,  nan, ...,  nan,  nan,  nan],
       [ nan,  nan,  nan, ...,  nan,  nan,  nan]])
Coordinates:
* time (time) datetime64[ns] 1978-10-01 1978-10-02 ... 2023-02-25
* site_id (site_id) object 'SNOTEL:1000_OR_SNTL' ... 'SNOTEL:999_WA_SNTL'
lon (site_id) float64 -122.2 -105.4 -116.9 ... -110.8 -121.4 -121.7
lat (site_id) float64 42.87 37.61 40.36 46.91 ... 40.89 48.86 48.76
elev (site_id) float64 1.832e+03 3.246e+03 ... 1.606e+03 1.073e+03
Attributes:
description: SNOTEL snow depth measurements (SNWD_D)
units: inchesds['WTEQ_D']
<xarray.DataArray 'WTEQ_D' (time: 16219, site_id: 806)>
array([[ nan,  nan,  nan, ...,  nan,  nan,  nan],
       [ nan,  nan,  nan, ...,  nan,  nan,  nan],
       [ nan,  nan,  nan, ...,  nan,  nan,  nan],
       ...,
       [ nan,  nan,  nan, ...,  nan, 63.2, 39.1],
       [ nan,  nan,  nan, ...,  nan, 61.7, 39. ],
       [ nan,  nan,  nan, ...,  nan, 61.9, 39.1]])
Coordinates:
* time (time) datetime64[ns] 1978-10-01 1978-10-02 ... 2023-02-25
* site_id (site_id) object 'SNOTEL:1000_OR_SNTL' ... 'SNOTEL:999_WA_SNTL'
lon (site_id) float64 -122.2 -105.4 -116.9 ... -110.8 -121.4 -121.7
lat (site_id) float64 42.87 37.61 40.36 46.91 ... 40.89 48.86 48.76
elev (site_id) float64 1.832e+03 3.246e+03 ... 1.606e+03 1.073e+03
Attributes:
description: SNOTEL snow water equivalent measurements (WTEQ_D)
units: inches w.e.Write out as NetCDF file#
Better than random pickle file
out_fn = os.path.join(snotel_datadir, 'SNOTEL_CONUS_all.nc')
#ds.to_netcdf?
ds.to_netcdf(out_fn)
reopened = xr.open_dataset(out_fn)
reopened
<xarray.Dataset>
Dimensions: (time: 16219, site_id: 806)
Coordinates:
* time (time) datetime64[ns] 1978-10-01 1978-10-02 ... 2023-02-25
* site_id (site_id) object 'SNOTEL:1000_OR_SNTL' ... 'SNOTEL:999_WA_SNTL'
lon (site_id) float64 ...
lat (site_id) float64 ...
elev (site_id) float64 ...
Data variables:
SNWD_D (time, site_id) float64 ...
WTEQ_D (time, site_id) float64 ...reopened.close()
Selection on DataSet#
#Paradise
sitecode = 'SNOTEL:679_WA_SNTL'
ds.sel(site_id=sitecode)
<xarray.Dataset>
Dimensions: (time: 16219)
Coordinates:
* time (time) datetime64[ns] 1978-10-01 1978-10-02 ... 2023-02-25
site_id <U18 'SNOTEL:679_WA_SNTL'
lon float64 -121.7
lat float64 46.78
elev float64 1.564e+03
Data variables:
SNWD_D (time) float64 nan nan nan nan nan nan ... 118.0 123.0 nan nan nan
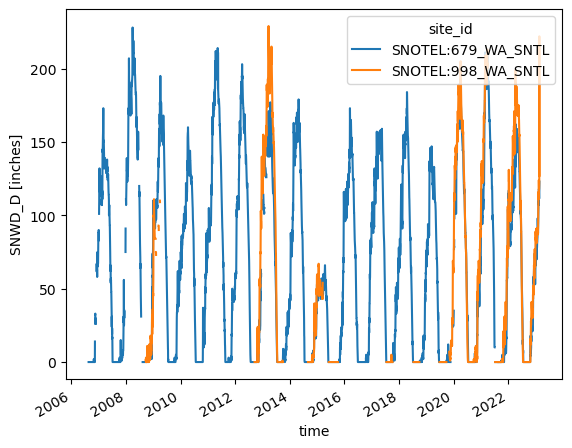
WTEQ_D (time) float64 nan nan nan nan nan nan ... 47.8 48.8 49.1 49.8 49.9#List of sites (Paradise and Easy Pass)
sitecode_list = ['SNOTEL:679_WA_SNTL', 'SNOTEL:998_WA_SNTL']
ds.sel(site_id=sitecode_list)
<xarray.Dataset>
Dimensions: (time: 16219, site_id: 2)
Coordinates:
* time (time) datetime64[ns] 1978-10-01 1978-10-02 ... 2023-02-25
* site_id (site_id) object 'SNOTEL:679_WA_SNTL' 'SNOTEL:998_WA_SNTL'
lon (site_id) float64 -121.7 -121.4
lat (site_id) float64 46.78 48.86
elev (site_id) float64 1.564e+03 1.606e+03
Data variables:
SNWD_D (time, site_id) float64 nan nan nan nan nan ... nan nan nan nan
WTEQ_D (time, site_id) float64 nan nan nan nan nan ... 49.8 61.7 49.9 61.9ds.sel(time='2023-02-23')
<xarray.Dataset>
Dimensions: (site_id: 806)
Coordinates:
time datetime64[ns] 2023-02-23
* site_id (site_id) object 'SNOTEL:1000_OR_SNTL' ... 'SNOTEL:999_WA_SNTL'
lon (site_id) float64 -122.2 -105.4 -116.9 ... -110.8 -121.4 -121.7
lat (site_id) float64 42.87 37.61 40.36 46.91 ... 40.89 48.86 48.76
elev (site_id) float64 1.832e+03 3.246e+03 ... 1.606e+03 1.073e+03
Data variables:
SNWD_D (site_id) float64 90.0 25.0 56.0 61.0 54.0 ... 0.0 43.0 127.0 101.0
WTEQ_D (site_id) float64 nan nan nan nan nan ... 24.6 nan nan 63.2 39.1Plotting#
Mostly for DataArray, not DataSet
#Doesn't work
#ds.sel(site_id=sitecode).plot()
ds.sel(site_id=sitecode)['WTEQ_D']
<xarray.DataArray 'WTEQ_D' (time: 16219)>
array([ nan, nan, nan, ..., 49.1, 49.8, 49.9])
Coordinates:
* time (time) datetime64[ns] 1978-10-01 1978-10-02 ... 2023-02-25
site_id <U18 'SNOTEL:679_WA_SNTL'
lon float64 -121.7
lat float64 46.78
elev float64 1.564e+03
Attributes:
description: SNOTEL snow water equivalent measurements (WTEQ_D)
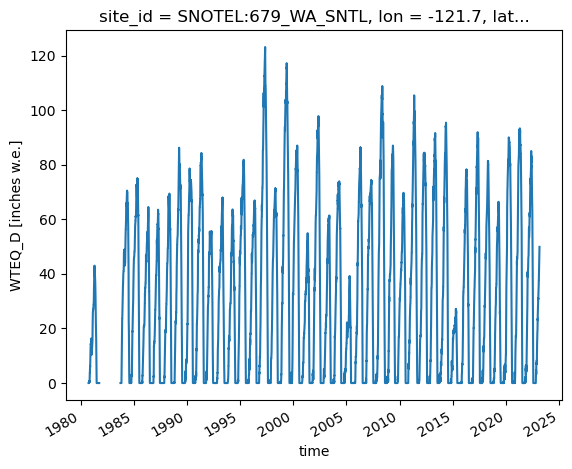
units: inches w.e.ds.sel(site_id=sitecode)['WTEQ_D'].plot();
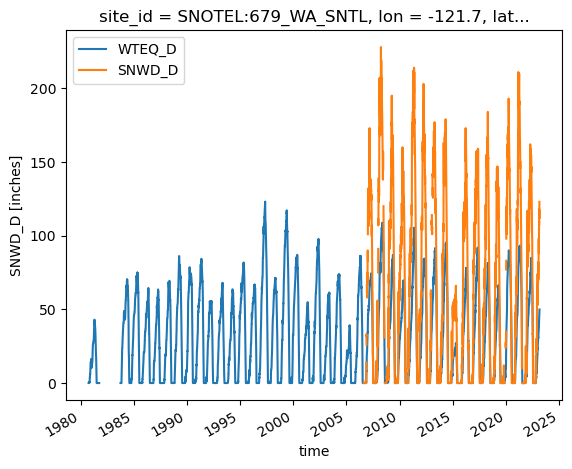
f, ax = plt.subplots()
ds.sel(site_id=sitecode)['WTEQ_D'].plot(ax=ax, label='WTEQ_D')
ds.sel(site_id=sitecode)['SNWD_D'].plot(ax=ax, label='SNWD_D')
ax.legend();
ds.sel(site_id=sitecode_list)['SNWD_D']
<xarray.DataArray 'SNWD_D' (time: 16219, site_id: 2)>
array([[ nan, nan],
[ nan, nan],
[ nan, nan],
...,
[ nan, 127.],
[ nan, nan],
[ nan, nan]])
Coordinates:
* time (time) datetime64[ns] 1978-10-01 1978-10-02 ... 2023-02-25
* site_id (site_id) object 'SNOTEL:679_WA_SNTL' 'SNOTEL:998_WA_SNTL'
lon (site_id) float64 -121.7 -121.4
lat (site_id) float64 46.78 48.86
elev (site_id) float64 1.564e+03 1.606e+03
Attributes:
description: SNOTEL snow depth measurements (SNWD_D)
units: inchesds.sel(site_id=sitecode_list)['SNWD_D'].plot.line(x="time");
#Remember we used hvplot for pandas
#import hvplot.pandas
import hvplot.xarray
#ds.sel(site_id=sitecode).hvplot()
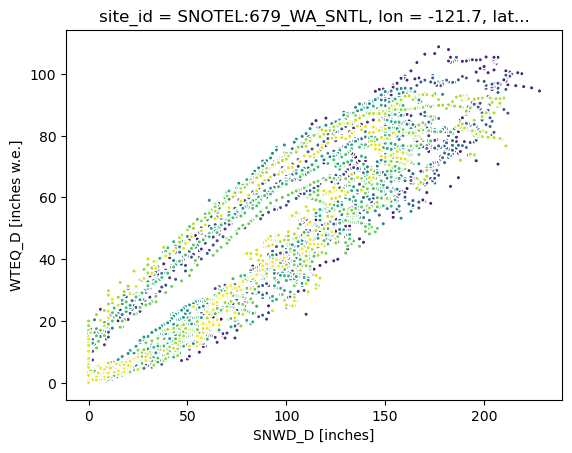
ds.sel(site_id=sitecode).plot.scatter(x="SNWD_D", y="WTEQ_D", s=10, c=ds.isel(site_id=0)['time']);
#ds.hvplot(kind='scatter', x='lon', y='lat', c='elev', aspect='equal')
Interactive plot with time slider#
#ds.hvplot(kind='scatter', x='lon', y='lat', c='SNWD_D', aspect='equal', clim=(0,150), cmap='inferno')
Add projected coordinates#
from pyproj import CRS, Transformer
crs_4326 = CRS.from_epsg(4326)
#Use our equal area projection from previous labs
crs_aea = CRS.from_proj4('+proj=aea +lat_1=37.00 +lat_2=47.00 +lat_0=42.00 +lon_0=-114.27')
transformer = Transformer.from_crs(crs_4326, crs_aea)
transformer
<Concatenated Operation Transformer: pipeline>
Description: axis order change (2D) + unknown
Area of Use:
- name: World
- bounds: (-180.0, -90.0, 180.0, 90.0)
x, y = transformer.transform(ds['lat'], ds['lon'])
x[0:10], y[0:10]
(array([-641830.34227843, 783444.60403791, -219670.85812494,
260151.57870442, 256411.14413521, -545201.83052402,
-563757.73421726, -609610.91738397, 225520.62714738,
702809.29230722]),
array([ 126514.02974903, -447629.27923716, -179747.45522562,
552612.93311311, 553958.49455869, 92343.21913656,
784714.06105929, 492131.94845037, -19505.12211235,
-211932.9662484 ]))
Assign as new alternative coordinates (preserving original dimensions)#
ds
<xarray.Dataset>
Dimensions:  (time: 16219, site_id: 806)
Coordinates:
  * time     (time) datetime64[ns] 1978-10-01 1978-10-02 ... 2023-02-25
  * site_id  (site_id) object 'SNOTEL:1000_OR_SNTL' ... 'SNOTEL:999_WA_SNTL'
    lon      (site_id) float64 -122.2 -105.4 -116.9 ... -110.8 -121.4 -121.7
    lat      (site_id) float64 42.87 37.61 40.36 46.91 ... 40.89 48.86 48.76
    elev     (site_id) float64 1.832e+03 3.246e+03 ... 1.606e+03 1.073e+03
Data variables:
    SNWD_D   (time, site_id) float64 nan nan nan nan nan ... nan nan nan nan nan
WTEQ_D (time, site_id) float64 nan nan nan nan nan ... nan nan 61.9 39.1ds = ds.assign_coords(x=('site_id', x), y=('site_id', y))
ds
<xarray.Dataset>
Dimensions:  (time: 16219, site_id: 806)
Coordinates:
  * time     (time) datetime64[ns] 1978-10-01 1978-10-02 ... 2023-02-25
  * site_id  (site_id) object 'SNOTEL:1000_OR_SNTL' ... 'SNOTEL:999_WA_SNTL'
    lon      (site_id) float64 -122.2 -105.4 -116.9 ... -110.8 -121.4 -121.7
    lat      (site_id) float64 42.87 37.61 40.36 46.91 ... 40.89 48.86 48.76
    elev     (site_id) float64 1.832e+03 3.246e+03 ... 1.606e+03 1.073e+03
    x        (site_id) float64 -6.418e+05 7.834e+05 ... -5.274e+05 -5.474e+05
    y        (site_id) float64 1.265e+05 -4.476e+05 ... 7.854e+05 7.764e+05
Data variables:
    SNWD_D   (time, site_id) float64 nan nan nan nan nan ... nan nan nan nan nan
WTEQ_D (time, site_id) float64 nan nan nan nan nan ... nan nan 61.9 39.1#ds.hvplot(kind='scatter', x='x', y='y', c='SNWD_D', aspect='equal', cmap='inferno', s=5, clim=(0,150))