09 Introduction: Multidimensional (N-d) arrays, xarray, ERA5 climate reanalysis data
Contents
09 Introduction: Multidimensional (N-d) arrays, xarray, ERA5 climate reanalysis data
UW Geospatial Data Analysis
CEE498/CEWA599
David Shean
Introduction
This week we are going to do some basic analysis of climate reanalysis data. This could be useful for some of your projects, especially if considering time series data.
We will use a few different products from the state-of-the-art global ERA5 reanalysis, which currently span 1950-present with hourly timestep at up to a 9 km resolution.
We will use xarray to open, combine, analyze and plot the data.
xarray
Take a moment to review this high-level introduction:
“xarray (formerly xray) is an open source project and Python package that makes working with labelled multi-dimensional arrays simple, efficient, and fun!
Xarray introduces labels in the form of dimensions, coordinates and attributes on top of raw NumPy-like arrays, which allows for a more intuitive, more concise, and less error-prone developer experience. The package includes a large and growing library of domain-agnostic functions for advanced analytics and visualization with these data structures.
Xarray is inspired by and borrows heavily from pandas, the popular data analysis package focused on labelled tabular data. It is particularly tailored to working with netCDF files, which were the source of xarray’s data model, and integrates tightly with dask for parallel computing.”
Remember back to Lab03, when you tried to extract a column of elevation values from a 2D NumPy array, with something like myarray[:,4]? And then how much easier it was to do the same thing with a labeled pandas DataFrame mydf['glas_z']? Same deal here, just extended beyond 2D.
Why?
Excellent choice for working with large datasets, as it uses lazy evaluation and parallel processing with Dask: http://xarray.pydata.org/en/stable/dask.html
Lots of great tutorials and resources: https://xarray.pydata.org/en/stable/tutorials-and-videos.html
Big user community
Some feel it should be the defacto Python data science object: https://xarray.pydata.org/en/stable/getting-started-guide/why-xarray.html#goals-and-aspirations
Why not?
General means complicated
Steep learning curve, esp for new users unfamiliar with Pandas
Sometimes overkill for simple problems
xarray data model overview
So, what’s an nD array? (https://docs.scipy.org/doc/numpy-1.13.0/reference/arrays.ndarray.html) You’ve been using them all quarter, but mostly 1D and 2D NumPy arrays.
As with many of the packages we’ve covered this quarter, vocabulary can be one of the biggest blocks to learning. Let’s discuss.
 (http://xarray.pydata.org/en/latest/data-structures.html#dataset)
Comparison with Pandas
Pandas is very good at handling 2D tabular datasets (e.g., csv with columns and rows, time series of met station variables from a single station [T, precip, etc]) or a single variable across multiple stations.
“If your data fits nicely into a pandas DataFrame then you’re better off using one of the more developed tools there.” (https://xarray.pydata.org/en/latest/user-guide/plotting.html)
“pandas excels at working with tabular data. That suffices for many statistical analyses, but physical scientists rely on N-dimensional arrays – which is where xarray comes in.” (http://xarray.pydata.org/en/stable/why-xarray.html#goals-and-aspirations)
xarray extends the Pandas functionality to support 3+ dimensions (e.g., time series of 2D rasters).
xarray is to Pandas…
xarray DataArray : Pandas DataSeries
xarray DataSet : Pandas DataFrame
Terminology
https://xarray.pydata.org/en/stable/user-guide/terminology.html
https://xarray.pydata.org/en/latest/user-guide/data-structures.html#data-structures
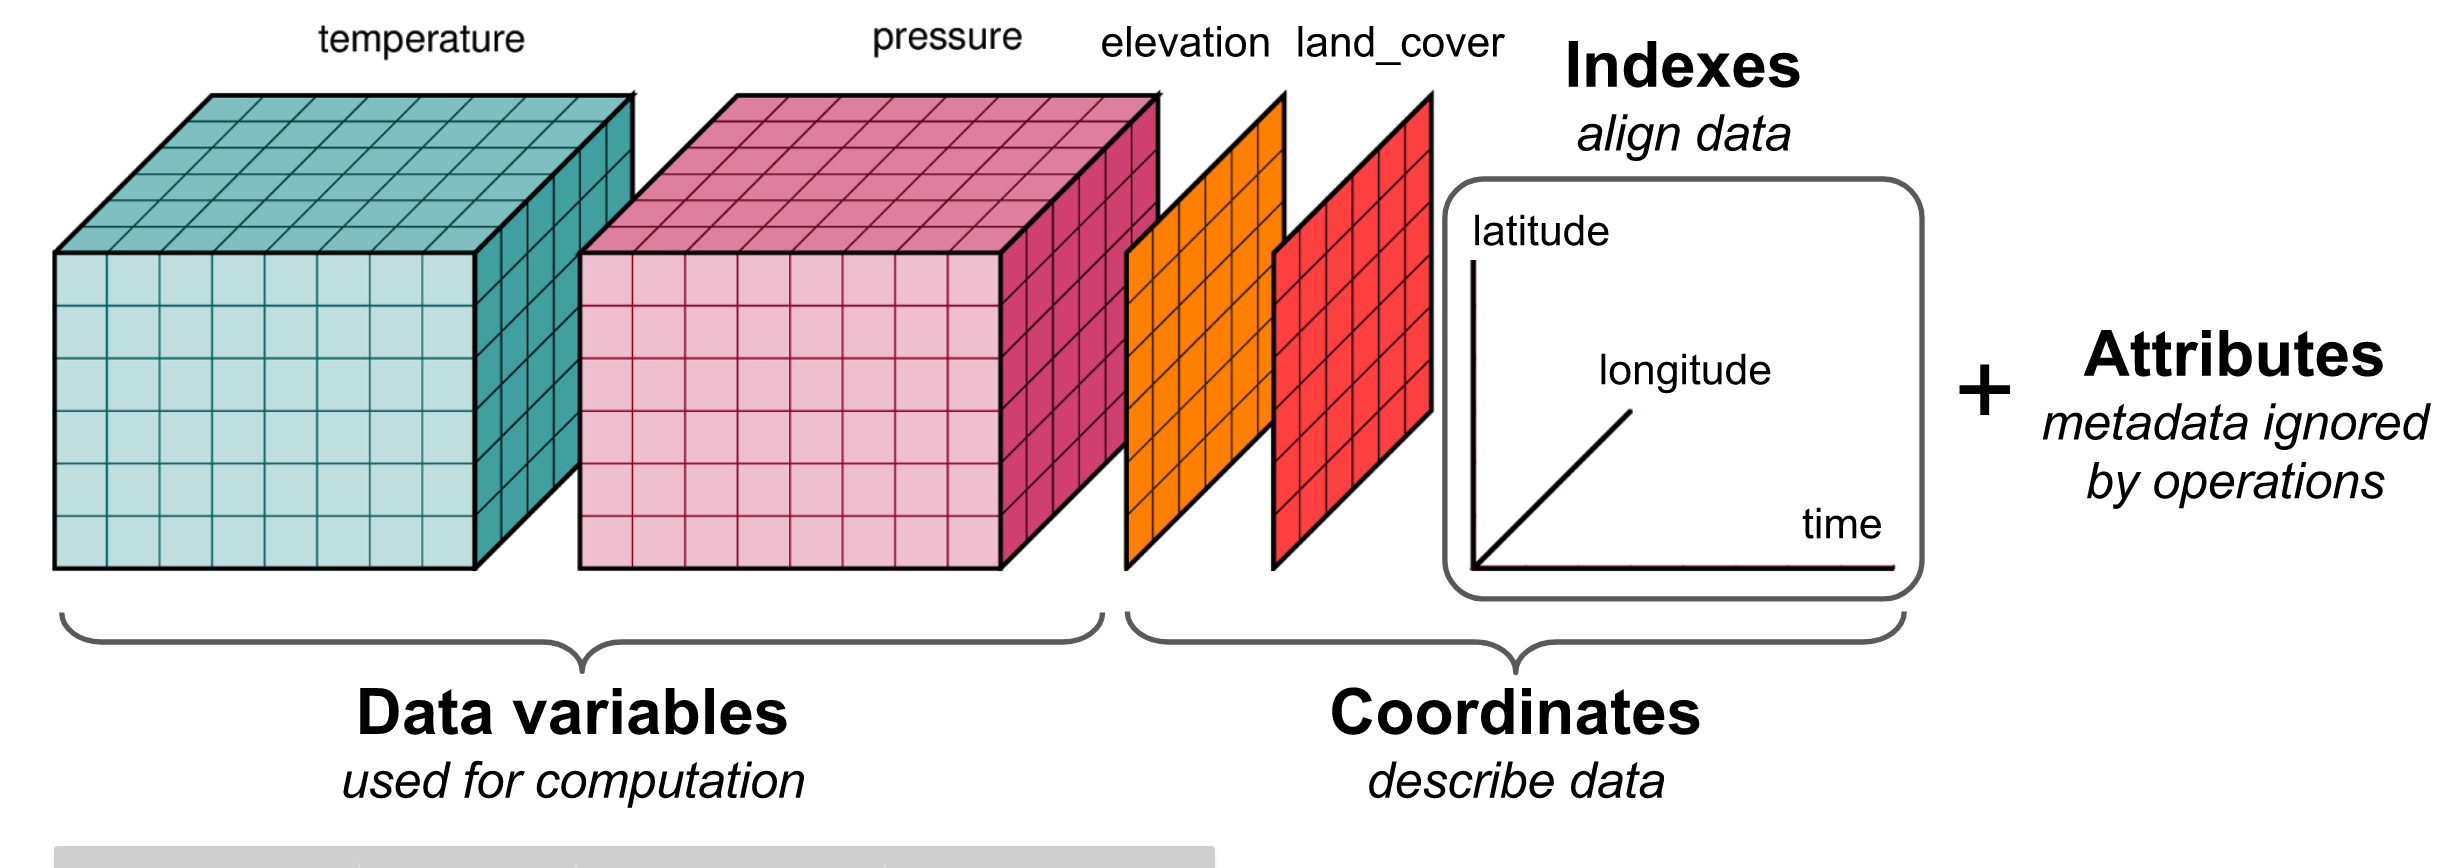
DataArray
Four essential pieces:
values: a numpy.ndarrays with actual data values (e.g., (‘t2m’, ‘tp’)dims: dimension names for each axis (e.g., (‘lon’, ‘lat’, ‘time’))coords: a dict-like container of arrays (coordinates) that label each point (e.g., 1-dimensional arrays of numbers, datetime objects or strings)attrs: an OrderedDict containing additional metadata (attributes)
Why do we need both?
“Dimensions provide names that xarray uses instead of the axis argument found in many numpy functions. Coordinates enable fast label based indexing and alignment, building on the functionality of the index found on a pandas DataFrame or Series.”
Dataset
Essentially, a collection of DataArrays (like a dictionary of DataArrays)
http://xarray.pydata.org/en/latest/data-structures.html#dataset
Notes:
One value in one of the contained arrays (say a single temperature measurement) usually has multiple coordinates (‘lon’, ‘lat’, ‘time’)
Useful xarray examples and references
Indexing and selection: https://xarray.pydata.org/en/stable/user-guide/indexing.html
Plotting: https://xarray.pydata.org/en/stable/user-guide/plotting.html
Visualization examples: http://xarray.pydata.org/en/stable/examples/visualization_gallery.html
Time-series analysis: https://xarray.pydata.org/en/stable/user-guide/time-series.html
netCDF format
Much of the xarray design and functionality is derived from the NetCDF project:
“NetCDF (Network Common Data Form) is a set of software libraries and machine-independent data formats that support the creation, access, and sharing of array-oriented scientific data. It is also a community standard for sharing scientific data.” [https://www.unidata.ucar.edu/software/netcdf/]
“Data in netCDF format is:
Self-Describing. A netCDF file includes information about the data it contains.
Portable. A netCDF file can be accessed by computers with different ways of storing integers, characters, and floating-point numbers.
Scalable. Small subsets of large datasets in various formats may be accessed efficiently through netCDF interfaces, even from remote servers.
Appendable. Data may be appended to a properly structured netCDF file without copying the dataset or redefining its structure.
Sharable. One writer and multiple readers may simultaneously access the same netCDF file.
Archivable. Access to all earlier forms of netCDF data will be supported by current and future versions of the software.”
“Commonly used in climatology, meteorology and oceanography applications (e.g., weather forecasting, climate change) and GIS applications.” [https://en.wikipedia.org/wiki/NetCDF]
import xarray as xr
import os
import geopandas as gpd
import pandas as pd
import numpy as np
import matplotlib.pyplot as plt
Demo: Create simple DataArray
data = np.random.rand(4, 3)
data
array([[0.59930315, 0.31652312, 0.17450757],
       [0.78045485, 0.08850642, 0.93117557],
       [0.40051498, 0.10657858, 0.60082638],
       [0.53881418, 0.055851  , 0.45250818]])
#xr.DataArray?
xr.DataArray(data)
<xarray.DataArray (dim_0: 4, dim_1: 3)>
array([[0.59930315, 0.31652312, 0.17450757],
       [0.78045485, 0.08850642, 0.93117557],
       [0.40051498, 0.10657858, 0.60082638],
       [0.53881418, 0.055851  , 0.45250818]])
Dimensions without coordinates: dim_0, dim_1- dim_0: 4
- dim_1: 3
- 0.5993 0.3165 0.1745 0.7805 0.08851 ... 0.6008 0.5388 0.05585 0.4525
array([[0.59930315, 0.31652312, 0.17450757],
       [0.78045485, 0.08850642, 0.93117557],
       [0.40051498, 0.10657858, 0.60082638],
       [0.53881418, 0.055851  , 0.45250818]])
locs = ["WA", "OR", "CA"]
times = pd.date_range("2000-01-01", periods=4)
times
DatetimeIndex(['2000-01-01', '2000-01-02', '2000-01-03', '2000-01-04'], dtype='datetime64[ns]', freq='D')
foo = xr.DataArray(data, coords=[times, locs], dims=["time", "space"])
foo
<xarray.DataArray (time: 4, space: 3)>
array([[0.59930315, 0.31652312, 0.17450757],
       [0.78045485, 0.08850642, 0.93117557],
       [0.40051498, 0.10657858, 0.60082638],
       [0.53881418, 0.055851  , 0.45250818]])
Coordinates:
  * time     (time) datetime64[ns] 2000-01-01 2000-01-02 2000-01-03 2000-01-04
* space (space) <U2 'WA' 'OR' 'CA'- time: 4
- space: 3
- 0.5993 0.3165 0.1745 0.7805 0.08851 ... 0.6008 0.5388 0.05585 0.4525
array([[0.59930315, 0.31652312, 0.17450757], [0.78045485, 0.08850642, 0.93117557], [0.40051498, 0.10657858, 0.60082638], [0.53881418, 0.055851 , 0.45250818]]) - time(time)datetime64[ns]2000-01-01 ... 2000-01-04
array(['2000-01-01T00:00:00.000000000', '2000-01-02T00:00:00.000000000', '2000-01-03T00:00:00.000000000', '2000-01-04T00:00:00.000000000'], dtype='datetime64[ns]') - space(space)<U2'WA' 'OR' 'CA'
array(['WA', 'OR', 'CA'], dtype='<U2')
Indexing
foo[0, :]
<xarray.DataArray (space: 3)>
array([0.59930315, 0.31652312, 0.17450757])
Coordinates:
    time     datetime64[ns] 2000-01-01
* space (space) <U2 'WA' 'OR' 'CA'- space: 3
- 0.5993 0.3165 0.1745
array([0.59930315, 0.31652312, 0.17450757])
- time()datetime64[ns]2000-01-01
array('2000-01-01T00:00:00.000000000', dtype='datetime64[ns]') - space(space)<U2'WA' 'OR' 'CA'
array(['WA', 'OR', 'CA'], dtype='<U2')
foo.loc['2000-01-03']
<xarray.DataArray (space: 3)>
array([0.40051498, 0.10657858, 0.60082638])
Coordinates:
    time     datetime64[ns] 2000-01-03
* space (space) <U2 'WA' 'OR' 'CA'- space: 3
- 0.4005 0.1066 0.6008
array([0.40051498, 0.10657858, 0.60082638])
- time()datetime64[ns]2000-01-03
array('2000-01-03T00:00:00.000000000', dtype='datetime64[ns]') - space(space)<U2'WA' 'OR' 'CA'
array(['WA', 'OR', 'CA'], dtype='<U2')
#foo.loc['WA', '2000-01-03']
foo.sel(time='2000-01-03', space='OR')
<xarray.DataArray ()>
array(0.10657858)
Coordinates:
    time     datetime64[ns] 2000-01-03
space <U2 'OR'- 0.1066
array(0.10657858)
- time()datetime64[ns]2000-01-03
array('2000-01-03T00:00:00.000000000', dtype='datetime64[ns]') - space()<U2'OR'
array('OR', dtype='<U2')
foo.sel(space='OR', time='2000-01-03')
<xarray.DataArray ()>
array(0.10657858)
Coordinates:
    time     datetime64[ns] 2000-01-03
space <U2 'OR'- 0.1066
array(0.10657858)
- time()datetime64[ns]2000-01-03
array('2000-01-03T00:00:00.000000000', dtype='datetime64[ns]') - space()<U2'OR'
array('OR', dtype='<U2')
foo.isel(time=3)
Demo: Create xarray DataSet from SNOTEL data
snotel_datadir = '../08_Vector_TimeSeries_SNOTEL'
sites_fn = os.path.join(snotel_datadir, 'snotel_conus_sites.json')
#singlesite_pkl_fn = 'SNOTEL-SNWD_D_679_WA_SNTL.pkl'
allsites_SNWD_pkl_fn = os.path.join(snotel_datadir, 'SNOTEL-SNWD_D_CONUS_all.pkl')
allsites_WTEQ_pkl_fn = os.path.join(snotel_datadir, 'SNOTEL-WTEQ_D_CONUS_all.pkl')
sites_gdf_all = gpd.read_file(sites_fn).set_index('index')
allsites_snwd_df = pd.read_pickle(allsites_SNWD_pkl_fn).dropna(axis=0, how='all')
allsites_wteq_df = pd.read_pickle(allsites_WTEQ_pkl_fn).dropna(axis=0, how='all')
sites_gdf_all
| code | name | network | elevation_m | site_property | geometry | |
|---|---|---|---|---|---|---|
| index | ||||||
| SNOTEL:301_CA_SNTL | 301_CA_SNTL | Adin Mtn | SNOTEL | 1886.712036 | {'county': 'Modoc', 'state': 'California', 'si... | POINT (-120.79192 41.23583) |
| SNOTEL:907_UT_SNTL | 907_UT_SNTL | Agua Canyon | SNOTEL | 2712.719971 | {'county': 'Kane', 'state': 'Utah', 'site_comm... | POINT (-112.27118 37.52217) |
| SNOTEL:916_MT_SNTL | 916_MT_SNTL | Albro Lake | SNOTEL | 2529.840088 | {'county': 'Madison', 'state': 'Montana', 'sit... | POINT (-111.95902 45.59723) |
| SNOTEL:908_WA_SNTL | 908_WA_SNTL | Alpine Meadows | SNOTEL | 1066.800049 | {'county': 'King', 'state': 'Washington', 'sit... | POINT (-121.69847 47.77957) |
| SNOTEL:302_OR_SNTL | 302_OR_SNTL | Aneroid Lake #2 | SNOTEL | 2255.520020 | {'county': 'Wallowa', 'state': 'Oregon', 'site... | POINT (-117.19258 45.21328) |
| ... | ... | ... | ... | ... | ... | ... |
| SNOTEL:877_AZ_SNTL | 877_AZ_SNTL | Workman Creek | SNOTEL | 2103.120117 | {'county': 'Gila', 'state': 'Arizona', 'site_c... | POINT (-110.91773 33.81242) |
| SNOTEL:1228_UT_SNTL | 1228_UT_SNTL | Wrigley Creek | SNOTEL | 2842.869629 | {'county': 'Sanpete', 'state': 'Utah', 'site_c... | POINT (-111.35685 39.13233) |
| SNOTEL:1197_UT_SNTL | 1197_UT_SNTL | Yankee Reservoir | SNOTEL | 2649.321533 | {'county': 'Iron', 'state': 'Utah', 'site_comm... | POINT (-112.77495 37.74797) |
| SNOTEL:878_WY_SNTL | 878_WY_SNTL | Younts Peak | SNOTEL | 2545.080078 | {'county': 'Park', 'state': 'Wyoming', 'site_c... | POINT (-109.81775 43.93225) |
| SNOTEL:1033_CO_SNTL | 1033_CO_SNTL | Zirkel | SNOTEL | 2846.832031 | {'county': 'Jackson', 'state': 'Colorado', 'si... | POINT (-106.59535 40.79488) |
865 rows × 6 columns
allsites_snwd_df
| SNOTEL:301_CA_SNTL | SNOTEL:907_UT_SNTL | SNOTEL:916_MT_SNTL | SNOTEL:908_WA_SNTL | SNOTEL:302_OR_SNTL | SNOTEL:1000_OR_SNTL | SNOTEL:303_CO_SNTL | SNOTEL:1030_CO_SNTL | SNOTEL:304_OR_SNTL | SNOTEL:306_ID_SNTL | ... | SNOTEL:872_WY_SNTL | SNOTEL:873_OR_SNTL | SNOTEL:874_CO_SNTL | SNOTEL:875_WY_SNTL | SNOTEL:876_MT_SNTL | SNOTEL:877_AZ_SNTL | SNOTEL:1228_UT_SNTL | SNOTEL:1197_UT_SNTL | SNOTEL:878_WY_SNTL | SNOTEL:1033_CO_SNTL | |
|---|---|---|---|---|---|---|---|---|---|---|---|---|---|---|---|---|---|---|---|---|---|
| datetime | |||||||||||||||||||||
| 1984-10-01 00:00:00+00:00 | NaN | NaN | NaN | NaN | NaN | NaN | NaN | NaN | NaN | NaN | ... | NaN | NaN | NaN | NaN | NaN | NaN | NaN | NaN | NaN | NaN |
| 1984-10-02 00:00:00+00:00 | NaN | NaN | NaN | NaN | NaN | NaN | NaN | NaN | NaN | NaN | ... | NaN | NaN | NaN | NaN | NaN | NaN | NaN | NaN | NaN | NaN |
| 1984-10-03 00:00:00+00:00 | NaN | NaN | NaN | NaN | NaN | NaN | NaN | NaN | NaN | NaN | ... | NaN | NaN | NaN | NaN | NaN | NaN | NaN | NaN | NaN | NaN |
| 1984-10-04 00:00:00+00:00 | NaN | NaN | NaN | NaN | NaN | NaN | NaN | NaN | NaN | NaN | ... | NaN | NaN | NaN | NaN | NaN | NaN | NaN | NaN | NaN | NaN |
| 1984-10-13 00:00:00+00:00 | NaN | NaN | NaN | NaN | NaN | NaN | NaN | NaN | NaN | NaN | ... | NaN | NaN | NaN | NaN | NaN | NaN | NaN | NaN | NaN | NaN |
| ... | ... | ... | ... | ... | ... | ... | ... | ... | ... | ... | ... | ... | ... | ... | ... | ... | ... | ... | ... | ... | ... |
| 2022-02-16 00:00:00+00:00 | 28.0 | 18.0 | 40.0 | 68.0 | 33.0 | 53.0 | 14.0 | 54.0 | 36.0 | 59.0 | ... | 18.0 | 38.0 | 73.0 | 31.0 | 24.0 | 0.0 | 23.0 | 15.0 | 25.0 | 52.0 |
| 2022-02-17 00:00:00+00:00 | 27.0 | 18.0 | 44.0 | 70.0 | 35.0 | 52.0 | 16.0 | 59.0 | 36.0 | 59.0 | ... | NaN | 38.0 | 75.0 | 30.0 | 26.0 | NaN | 24.0 | 20.0 | 30.0 | 58.0 |
| 2022-02-18 00:00:00+00:00 | 27.0 | 18.0 | 44.0 | 69.0 | 35.0 | 52.0 | 15.0 | 57.0 | 37.0 | 58.0 | ... | 23.0 | 38.0 | 77.0 | 30.0 | 25.0 | 0.0 | 24.0 | 18.0 | 30.0 | 56.0 |
| 2022-02-19 00:00:00+00:00 | 26.0 | 19.0 | 43.0 | 69.0 | 35.0 | 52.0 | 14.0 | NaN | 37.0 | 58.0 | ... | 22.0 | 37.0 | 77.0 | 30.0 | 25.0 | 0.0 | 23.0 | 18.0 | 30.0 | 57.0 |
| 2022-02-20 00:00:00+00:00 | 25.0 | 18.0 | 43.0 | 74.0 | 34.0 | 52.0 | 14.0 | 56.0 | 37.0 | 58.0 | ... | 21.0 | 37.0 | 75.0 | 28.0 | 28.0 | NaN | 23.0 | 17.0 | 30.0 | 55.0 |
10439 rows × 805 columns
allsites_wteq_df
| SNOTEL:301_CA_SNTL | SNOTEL:907_UT_SNTL | SNOTEL:916_MT_SNTL | SNOTEL:908_WA_SNTL | SNOTEL:302_OR_SNTL | SNOTEL:1000_OR_SNTL | SNOTEL:303_CO_SNTL | SNOTEL:1030_CO_SNTL | SNOTEL:304_OR_SNTL | SNOTEL:305_CO_SNTL | ... | SNOTEL:872_WY_SNTL | SNOTEL:873_OR_SNTL | SNOTEL:874_CO_SNTL | SNOTEL:875_WY_SNTL | SNOTEL:876_MT_SNTL | SNOTEL:877_AZ_SNTL | SNOTEL:1228_UT_SNTL | SNOTEL:1197_UT_SNTL | SNOTEL:878_WY_SNTL | SNOTEL:1033_CO_SNTL | |
|---|---|---|---|---|---|---|---|---|---|---|---|---|---|---|---|---|---|---|---|---|---|
| datetime | |||||||||||||||||||||
| 1963-10-01 00:00:00+00:00 | NaN | NaN | NaN | NaN | NaN | NaN | NaN | NaN | NaN | NaN | ... | NaN | NaN | NaN | NaN | NaN | NaN | NaN | NaN | NaN | NaN |
| 1963-10-02 00:00:00+00:00 | NaN | NaN | NaN | NaN | NaN | NaN | NaN | NaN | NaN | NaN | ... | NaN | NaN | NaN | NaN | NaN | NaN | NaN | NaN | NaN | NaN |
| 1963-10-03 00:00:00+00:00 | NaN | NaN | NaN | NaN | NaN | NaN | NaN | NaN | NaN | NaN | ... | NaN | NaN | NaN | NaN | NaN | NaN | NaN | NaN | NaN | NaN |
| 1963-10-04 00:00:00+00:00 | NaN | NaN | NaN | NaN | NaN | NaN | NaN | NaN | NaN | NaN | ... | NaN | NaN | NaN | NaN | NaN | NaN | NaN | NaN | NaN | NaN |
| 1963-10-05 00:00:00+00:00 | NaN | NaN | NaN | NaN | NaN | NaN | NaN | NaN | NaN | NaN | ... | NaN | NaN | NaN | NaN | NaN | NaN | NaN | NaN | NaN | NaN |
| ... | ... | ... | ... | ... | ... | ... | ... | ... | ... | ... | ... | ... | ... | ... | ... | ... | ... | ... | ... | ... | ... |
| 2022-02-23 00:00:00+00:00 | 9.7 | 6.5 | 12.3 | 36.2 | 10.4 | 17.0 | 4.8 | 16.0 | 12.5 | NaN | ... | 4.2 | 6.0 | 27.9 | 8.6 | 7.1 | NaN | 7.2 | 5.9 | 10.7 | 19.3 |
| 2022-02-24 00:00:00+00:00 | 9.8 | 6.8 | 12.4 | 36.3 | 10.4 | 17.0 | 5.0 | 16.4 | 12.5 | NaN | ... | 4.4 | 6.0 | 29.4 | 8.7 | 7.3 | 0.8 | 7.2 | 6.1 | 10.9 | 19.6 |
| 2022-02-25 00:00:00+00:00 | 9.8 | 6.8 | 12.5 | 36.5 | 10.4 | 17.0 | 4.9 | 16.4 | 12.6 | NaN | ... | 4.6 | 6.0 | 29.6 | 8.7 | 7.3 | 0.7 | 7.2 | 6.1 | 11.1 | 19.6 |
| 2022-02-26 00:00:00+00:00 | 9.9 | 6.7 | 12.5 | 36.5 | 10.5 | 17.1 | 4.9 | 16.4 | 12.6 | NaN | ... | 4.7 | 6.0 | 29.7 | 8.7 | 7.3 | 0.7 | 7.4 | 5.9 | 11.0 | 19.7 |
| 2022-02-27 00:00:00+00:00 | 9.9 | 6.7 | 12.6 | 36.8 | 10.5 | 17.2 | 4.9 | 16.4 | 12.7 | NaN | ... | 4.7 | 6.0 | 29.6 | 8.8 | 7.4 | 0.7 | 7.4 | 6.1 | 11.1 | 19.6 |
21335 rows × 796 columns
allsites_wteq_df.dropna(how='all', axis=1)
| SNOTEL:301_CA_SNTL | SNOTEL:907_UT_SNTL | SNOTEL:916_MT_SNTL | SNOTEL:908_WA_SNTL | SNOTEL:302_OR_SNTL | SNOTEL:1000_OR_SNTL | SNOTEL:303_CO_SNTL | SNOTEL:1030_CO_SNTL | SNOTEL:304_OR_SNTL | SNOTEL:305_CO_SNTL | ... | SNOTEL:872_WY_SNTL | SNOTEL:873_OR_SNTL | SNOTEL:874_CO_SNTL | SNOTEL:875_WY_SNTL | SNOTEL:876_MT_SNTL | SNOTEL:877_AZ_SNTL | SNOTEL:1228_UT_SNTL | SNOTEL:1197_UT_SNTL | SNOTEL:878_WY_SNTL | SNOTEL:1033_CO_SNTL | |
|---|---|---|---|---|---|---|---|---|---|---|---|---|---|---|---|---|---|---|---|---|---|
| datetime | |||||||||||||||||||||
| 1963-10-01 00:00:00+00:00 | NaN | NaN | NaN | NaN | NaN | NaN | NaN | NaN | NaN | NaN | ... | NaN | NaN | NaN | NaN | NaN | NaN | NaN | NaN | NaN | NaN |
| 1963-10-02 00:00:00+00:00 | NaN | NaN | NaN | NaN | NaN | NaN | NaN | NaN | NaN | NaN | ... | NaN | NaN | NaN | NaN | NaN | NaN | NaN | NaN | NaN | NaN |
| 1963-10-03 00:00:00+00:00 | NaN | NaN | NaN | NaN | NaN | NaN | NaN | NaN | NaN | NaN | ... | NaN | NaN | NaN | NaN | NaN | NaN | NaN | NaN | NaN | NaN |
| 1963-10-04 00:00:00+00:00 | NaN | NaN | NaN | NaN | NaN | NaN | NaN | NaN | NaN | NaN | ... | NaN | NaN | NaN | NaN | NaN | NaN | NaN | NaN | NaN | NaN |
| 1963-10-05 00:00:00+00:00 | NaN | NaN | NaN | NaN | NaN | NaN | NaN | NaN | NaN | NaN | ... | NaN | NaN | NaN | NaN | NaN | NaN | NaN | NaN | NaN | NaN |
| ... | ... | ... | ... | ... | ... | ... | ... | ... | ... | ... | ... | ... | ... | ... | ... | ... | ... | ... | ... | ... | ... |
| 2022-02-23 00:00:00+00:00 | 9.7 | 6.5 | 12.3 | 36.2 | 10.4 | 17.0 | 4.8 | 16.0 | 12.5 | NaN | ... | 4.2 | 6.0 | 27.9 | 8.6 | 7.1 | NaN | 7.2 | 5.9 | 10.7 | 19.3 |
| 2022-02-24 00:00:00+00:00 | 9.8 | 6.8 | 12.4 | 36.3 | 10.4 | 17.0 | 5.0 | 16.4 | 12.5 | NaN | ... | 4.4 | 6.0 | 29.4 | 8.7 | 7.3 | 0.8 | 7.2 | 6.1 | 10.9 | 19.6 |
| 2022-02-25 00:00:00+00:00 | 9.8 | 6.8 | 12.5 | 36.5 | 10.4 | 17.0 | 4.9 | 16.4 | 12.6 | NaN | ... | 4.6 | 6.0 | 29.6 | 8.7 | 7.3 | 0.7 | 7.2 | 6.1 | 11.1 | 19.6 |
| 2022-02-26 00:00:00+00:00 | 9.9 | 6.7 | 12.5 | 36.5 | 10.5 | 17.1 | 4.9 | 16.4 | 12.6 | NaN | ... | 4.7 | 6.0 | 29.7 | 8.7 | 7.3 | 0.7 | 7.4 | 5.9 | 11.0 | 19.7 |
| 2022-02-27 00:00:00+00:00 | 9.9 | 6.7 | 12.6 | 36.8 | 10.5 | 17.2 | 4.9 | 16.4 | 12.7 | NaN | ... | 4.7 | 6.0 | 29.6 | 8.8 | 7.4 | 0.7 | 7.4 | 6.1 | 11.1 | 19.6 |
21335 rows × 796 columns
#allsites_snwd_df.to_xarray()
Note difference in number of records and columns
Some stations have one but not the other
WTEQ extends farther back in time
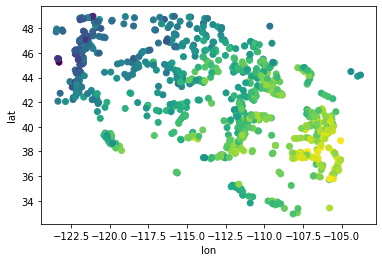
def get_DataArray(df, sites, name="SNWD_D"):
    valid_sites = sites.loc[df.columns]

    site_id = valid_sites.index.values
    lon = valid_sites.geometry.x.values
    lat = valid_sites.geometry.y.values
    elev = valid_sites.elevation_m.values
    site_name = valid_sites.name.values

    #da = xr.DataArray(df, dims=("time", "site_id"), name=name)
    da = xr.DataArray(df, dims=("time", "site_id"), coords=(df.index.values, site_id), name=name)
    #For some reason, the times are not read as datetime64 objects, so reassign
    da["time"] = df.index.values
    da = da.assign_coords(lon=("site_id", lon), lat=("site_id", lat), elev=("site_id", elev))
    return da
#sites_gdf_all.to_xarray()
snwd_da = get_DataArray(allsites_snwd_df, sites_gdf_all, name="SNWD_D")
snwd_da
<xarray.DataArray 'SNWD_D' (time: 10439, site_id: 805)>
array([[nan, nan, nan, ..., nan, nan, nan],
       [nan, nan, nan, ..., nan, nan, nan],
       [nan, nan, nan, ..., nan, nan, nan],
       ...,
       [27., 18., 44., ..., 18., 30., 56.],
       [26., 19., 43., ..., 18., 30., 57.],
       [25., 18., 43., ..., 17., 30., 55.]])
Coordinates:
  * time     (time) datetime64[ns] 1984-10-01 1984-10-02 ... 2022-02-20
  * site_id  (site_id) object 'Adin Mtn' 'Agua Canyon' ... 'Zirkel'
    lon      (site_id) float64 -120.8 -112.3 -112.0 ... -112.8 -109.8 -106.6
    lat      (site_id) float64 41.24 37.52 45.6 47.78 ... 37.75 43.93 40.79
elev (site_id) float64 1.887e+03 2.713e+03 ... 2.545e+03 2.847e+03- time: 10439
- site_id: 805
- nan nan nan nan nan nan nan nan ... 28.0 28.0 nan 23.0 17.0 30.0 55.0
array([[nan, nan, nan, ..., nan, nan, nan], [nan, nan, nan, ..., nan, nan, nan], [nan, nan, nan, ..., nan, nan, nan], ..., [27., 18., 44., ..., 18., 30., 56.], [26., 19., 43., ..., 18., 30., 57.], [25., 18., 43., ..., 17., 30., 55.]]) - time(time)datetime64[ns]1984-10-01 ... 2022-02-20
array(['1984-10-01T00:00:00.000000000', '1984-10-02T00:00:00.000000000', '1984-10-03T00:00:00.000000000', ..., '2022-02-18T00:00:00.000000000', '2022-02-19T00:00:00.000000000', '2022-02-20T00:00:00.000000000'], dtype='datetime64[ns]') - site_id(site_id)object'Adin Mtn' ... 'Zirkel'
array(['Adin Mtn', 'Agua Canyon', 'Albro Lake', ..., 'Yankee Reservoir', 'Younts Peak', 'Zirkel'], dtype=object) - lon(site_id)float64-120.8 -112.3 ... -109.8 -106.6
array([-120.79192352, -112.2711792 , -111.95902252, -121.69847107, -117.19258118, -122.16517639, -105.06748962, -106.38141632, -119.25392151, -115.23906708, -113.02317047, -111.40643311, -111.38272095, -107.84442139, -109.50344086, -115.44573212, -115.23446655, -111.60502625, -113.13037872, -110.4454422 , -112.52046967, -106.32128906, -107.26609039, -112.98191071, -116.14292908, -113.93797302, -115.45278168, -122.09380341, -105.6448288 , -116.07447815, -107.009552 , -110.82769775, -116.98097229, -107.06134796, -109.56742859, -107.51212311, -106.5114212 , -111.35852051, -111.55812836, -111.09781647, -109.21656799, -121.25550079, -118.21900177, -109.05711365, -111.94405365, -111.92102814, -114.62277985, -105.77789307, -112.25232697, -115.69309998, -117.1150589 , -115.79560852, -112.35671997, -107.20068359, -119.94219971, -122.85487366, -109.25965118, -123.34393311, -122.26616669, -114.64862823, -107.35681152, -113.99900818, -111.12802887, -111.59764862, -108.18364716, -105.66397095, -113.43094635, -106.71383667, -110.58280182, -114.35430145, -109.79332733, -121.85604858, -120.67960358, -110.60973358, -103.97688293, -113.50099182, -119.92436981, -118.51721954, -112.15348816, -116.09684753, ... -122.42536926, -105.19467926, -111.62957001, -111.56918335, -117.85050201, -106.67680359, -108.89572144, -107.23619843, -105.52713776, -110.94873047, -105.23233032, -120.84929657, -115.43817902, -110.59140015, -120.29412079, -109.67279816, -120.18406677, -114.44754791, -114.50559998, -110.22122192, -105.57614899, -111.24909973, -107.26014709, -106.83535004, -106.75421906, -120.37014771, -111.50602722, -105.37326813, -115.98339844, -106.81362152, -106.38005829, -107.50679779, -116.33660126, -112.41477966, -114.8527298 , -119.23432922, -107.36430359, -112.79087067, -120.21865082, -114.95574951, -113.16400146, -123.42594147, -106.92713928, -112.90155029, -121.78975677, -107.32151794, -105.54250336, -116.45413208, -111.09198761, -114.31021118, -105.12245178, -111.14997864, -106.90847778, -111.41085052, -112.14914703, -109.90986633, -121.38153076, -110.9884491 , -115.37921906, -111.88162994, -105.60247803, -109.4797287 , -112.47782898, -110.83515167, -106.09432983, -105.73336792, -115.0027771 , -105.57816315, -118.1519165 , -106.80169678, -109.65699768, -112.81427765, -110.91773224, -111.35684967, -112.77494812, -109.81774902, -106.59535217]) - lat(site_id)float6441.24 37.52 45.6 ... 43.93 40.79
array([41.2358284 , 37.52217102, 45.597229 , 47.77957153, 45.21327972, 42.87007141, 37.33061981, 40.35097885, 45.1908493 , 43.75690079, 48.13087845, 34.45660019, 34.45547104, 44.80070114, 33.97882843, 48.57120132, 44.30342102, 34.86135864, 46.09712982, 43.94018936, 45.79737091, 36.51216125, 41.05413055, 44.47146988, 44.95222092, 43.74367142, 41.83383942, 44.32529831, 40.31118011, 48.30577087, 40.06153107, 40.8852005 , 44.60533142, 43.88742828, 44.94306946, 37.71408844, 39.59917068, 44.94966125, 39.13682938, 40.61233139, 33.69144058, 48.87929916, 45.14532089, 36.32677841, 41.37602997, 41.38291168, 39.31917191, 39.80392075, 40.4618187 , 41.7616806 , 39.29148102, 44.62620926, 38.30183029, 44.57923889, 39.45500183, 42.05257034, 42.64580154, 42.07875061, 42.40716934, 39.46138 , 39.76486969, 47.6838913 , 44.50831985, 38.67990112, 37.78971863, 40.88800049, 46.41400146, 41.05615997, 40.95814133, 47.98287964, 44.37667084, 45.42869949, 47.3503685 , 42.9640007 , 44.10771942, 45.16506958, 38.60800171, 44.24766922, 38.94569016, 43.76377106, 44.67887878, 42.16442108, 46.55960083, 44.83052063, 45.3642807 , 45.27190018, 38.50809097, 38.49745941, 45.89107132, 37.67993927, 40.59936142, 36.31575012, 41.35884857, 40.58102036, 48.92755127, 39.08766174, 45.04315186, 39.13399887, 40.84455872, 37.86943054, ... 39.17161942, 39.74103928, 36.58203125, 42.69107819, 41.22869873, 45.07706833, 41.79299927, 40.97851944, 44.78562164, 40.62350082, 39.23802948, 44.14424896, 44.36917114, 48.52753067, 44.81243134, 44.02740097, 39.67712021, 40.42816925, 47.33198166, 44.65567017, 46.34936905, 41.31869888, 43.74901962, 43.22718048, 36.47492981, 41.89833069, 41.88573074, 46.11867905, 40.53742981, 42.69525146, 39.99884033, 36.12778091, 40.6780014 , 37.35327911, 48.0746994 , 43.62902832, 42.76393127, 47.23328018, 40.73899841, 39.30086899, 46.14287186, 46.14379883, 44.15177917, 40.03279114, 39.41550064, 37.72193909, 37.48575974, 38.99076843, 47.28733826, 41.86425018, 37.61497116, 39.44950104, 36.02634811, 39.61676025, 37.48509979, 44.37665176, 39.9366684 , 43.7994194 , 38.07297897, 37.88248062, 47.9199791 , 39.13544846, 39.13241959, 46.27368164, 47.94485092, 41.15945816, 37.57500076, 48.86610031, 37.51976013, 35.77555847, 45.07220078, 44.65866089, 39.00994873, 37.21411133, 44.61088181, 41.00289154, 44.53266907, 35.14202118, 45.04574966, 46.64141846, 39.96450043, 38.9455719 , 37.83633041, 40.2010498 , 33.75835037, 42.75743103, 42.81512833, 40.34703064, 40.43254089, 42.01256943, 42.28020096, 45.06703186, 37.47922134, 44.8041687 , 47.44847107, 33.81241989, 39.13233185, 37.74797058, 43.93225098, 40.79487991]) - elev(site_id)float641.887e+03 2.713e+03 ... 2.847e+03
array([1886.71203613, 2712.7199707 , 2529.84008789, 1066.80004883,
       2255.52001953, 1831.84802246, 3048.        , 3340.60791016,
       1758.69604492, 2310.3840332 , 2103.12011719, 2225.04003906,
       2346.95996094, 2859.02392578, 2781.30004883, 1706.88000488,
       2145.79199219, 1948.58642578, 2514.60009766, 2151.88793945,
       2188.46411133, 2834.63989258, 2267.71191406, 2697.47998047,
       1630.68005371, 2407.91992188, 2450.59204102, 1438.65600586,
       2895.60009766, 1645.92004395, 2767.58398438, 2675.22949219,
       1883.66394043, 2499.36010742, 2852.92797852, 3535.67993164,
       2590.80004883, 2392.67993164, 2435.35205078, 2523.74389648,
       2435.35205078, 1106.4239502 , 1569.7199707 , 2804.15991211,
       2343.60717773, 1820.265625  , 2858.10961914, 3444.23999023,
       1987.29602051, 2102.51049805, 2647.18798828, 1999.48803711,
       3154.37524414, 2435.35205078, 2510.02807617, 1844.04003906,
       2767.58398438, 1563.62402344, 1609.34399414, 2297.27758789,
       3316.22412109, 1499.6159668 , 2490.21606445, 2869.38720703,
       3529.58398438, 2718.81591797, 2197.60791016, 2993.13598633,
       2703.27124023, 1722.11999512, 2980.9440918 , 1112.52001953,
       1292.35205078, 2636.52001953, 2100.07202148, 2316.47998047,
       2458.8215332 , 1789.17602539, 2840.43115234, 1932.43200684,
...
        987.55200195, 3102.86401367, 2582.87524414, 1929.99365234,
       1685.54394531, 3200.39990234, 2651.76000977, 2956.56005859,
       2621.2800293 , 3045.56152344, 3310.12792969,  893.06402588,
       2368.29589844, 2590.80004883, 1670.30395508, 2901.08642578,
       1983.9432373 , 1706.88000488, 1950.7199707 , 2816.35205078,
       3139.43994141, 2620.06079102, 2865.12011719, 3108.95996094,
       3243.07202148, 1319.78405762, 2520.69604492, 3246.12011719,
       2404.87207031, 2836.46875   , 3139.43994141, 3316.22412109,
       1499.6159668 , 2255.82470703, 2731.00805664, 2878.8359375 ,
       3383.2800293 , 1706.88000488, 2055.87597656, 2804.15991211,
       2377.43994141, 1527.04797363, 2819.39990234, 2805.07446289,
       1228.34399414, 3273.55200195, 3389.37597656, 1694.68798828,
       2042.16003418, 3066.28808594, 3115.0559082 , 2072.63989258,
       2727.95996094, 2350.00805664, 2188.46411133, 2651.76000977,
       1353.31201172, 2633.77685547, 2245.46166992, 2938.27197266,
       2913.88793945, 2392.67993164, 1978.15197754, 2462.78393555,
       2907.79199219, 3261.36010742, 2170.17602539, 2407.91992188,
       1716.02404785, 3352.80004883, 2331.7199707 , 1816.60803223,
       2103.12011719, 2842.86962891, 2649.3215332 , 2545.08007812,
       2846.83203125])
snwd_da.attrs['description'] = 'SNOTEL snow depth measurements'
snwd_da.attrs['units'] = 'inches'
snwd_da
<xarray.DataArray 'SNWD_D' (time: 10439, site_id: 805)>
array([[nan, nan, nan, ..., nan, nan, nan],
       [nan, nan, nan, ..., nan, nan, nan],
       [nan, nan, nan, ..., nan, nan, nan],
       ...,
       [27., 18., 44., ..., 18., 30., 56.],
       [26., 19., 43., ..., 18., 30., 57.],
       [25., 18., 43., ..., 17., 30., 55.]])
Coordinates:
  * time     (time) datetime64[ns] 1984-10-01 1984-10-02 ... 2022-02-20
  * site_id  (site_id) object 'SNOTEL:301_CA_SNTL' ... 'SNOTEL:1033_CO_SNTL'
    lon      (site_id) float64 -120.8 -112.3 -112.0 ... -112.8 -109.8 -106.6
    lat      (site_id) float64 41.24 37.52 45.6 47.78 ... 37.75 43.93 40.79
    elev     (site_id) float64 1.887e+03 2.713e+03 ... 2.545e+03 2.847e+03
Attributes:
    description:  SNOTEL snow depth measurements
units: inches- time: 10439
- site_id: 805
- nan nan nan nan nan nan nan nan ... 28.0 28.0 nan 23.0 17.0 30.0 55.0
array([[nan, nan, nan, ..., nan, nan, nan], [nan, nan, nan, ..., nan, nan, nan], [nan, nan, nan, ..., nan, nan, nan], ..., [27., 18., 44., ..., 18., 30., 56.], [26., 19., 43., ..., 18., 30., 57.], [25., 18., 43., ..., 17., 30., 55.]]) - time(time)datetime64[ns]1984-10-01 ... 2022-02-20
array(['1984-10-01T00:00:00.000000000', '1984-10-02T00:00:00.000000000', '1984-10-03T00:00:00.000000000', ..., '2022-02-18T00:00:00.000000000', '2022-02-19T00:00:00.000000000', '2022-02-20T00:00:00.000000000'], dtype='datetime64[ns]') - site_id(site_id)object'SNOTEL:301_CA_SNTL' ... 'SNOTEL...
array(['SNOTEL:301_CA_SNTL', 'SNOTEL:907_UT_SNTL', 'SNOTEL:916_MT_SNTL', ..., 'SNOTEL:1197_UT_SNTL', 'SNOTEL:878_WY_SNTL', 'SNOTEL:1033_CO_SNTL'], dtype=object) - lon(site_id)float64-120.8 -112.3 ... -109.8 -106.6
array([-120.79192352, -112.2711792 , -111.95902252, -121.69847107, -117.19258118, -122.16517639, -105.06748962, -106.38141632, -119.25392151, -115.23906708, -113.02317047, -111.40643311, -111.38272095, -107.84442139, -109.50344086, -115.44573212, -115.23446655, -111.60502625, -113.13037872, -110.4454422 , -112.52046967, -106.32128906, -107.26609039, -112.98191071, -116.14292908, -113.93797302, -115.45278168, -122.09380341, -105.6448288 , -116.07447815, -107.009552 , -110.82769775, -116.98097229, -107.06134796, -109.56742859, -107.51212311, -106.5114212 , -111.35852051, -111.55812836, -111.09781647, -109.21656799, -121.25550079, -118.21900177, -109.05711365, -111.94405365, -111.92102814, -114.62277985, -105.77789307, -112.25232697, -115.69309998, -117.1150589 , -115.79560852, -112.35671997, -107.20068359, -119.94219971, -122.85487366, -109.25965118, -123.34393311, -122.26616669, -114.64862823, -107.35681152, -113.99900818, -111.12802887, -111.59764862, -108.18364716, -105.66397095, -113.43094635, -106.71383667, -110.58280182, -114.35430145, -109.79332733, -121.85604858, -120.67960358, -110.60973358, -103.97688293, -113.50099182, -119.92436981, -118.51721954, -112.15348816, -116.09684753, ... -122.42536926, -105.19467926, -111.62957001, -111.56918335, -117.85050201, -106.67680359, -108.89572144, -107.23619843, -105.52713776, -110.94873047, -105.23233032, -120.84929657, -115.43817902, -110.59140015, -120.29412079, -109.67279816, -120.18406677, -114.44754791, -114.50559998, -110.22122192, -105.57614899, -111.24909973, -107.26014709, -106.83535004, -106.75421906, -120.37014771, -111.50602722, -105.37326813, -115.98339844, -106.81362152, -106.38005829, -107.50679779, -116.33660126, -112.41477966, -114.8527298 , -119.23432922, -107.36430359, -112.79087067, -120.21865082, -114.95574951, -113.16400146, -123.42594147, -106.92713928, -112.90155029, -121.78975677, -107.32151794, -105.54250336, -116.45413208, -111.09198761, -114.31021118, -105.12245178, -111.14997864, -106.90847778, -111.41085052, -112.14914703, -109.90986633, -121.38153076, -110.9884491 , -115.37921906, -111.88162994, -105.60247803, -109.4797287 , -112.47782898, -110.83515167, -106.09432983, -105.73336792, -115.0027771 , -105.57816315, -118.1519165 , -106.80169678, -109.65699768, -112.81427765, -110.91773224, -111.35684967, -112.77494812, -109.81774902, -106.59535217]) - lat(site_id)float6441.24 37.52 45.6 ... 43.93 40.79
array([41.2358284 , 37.52217102, 45.597229 , 47.77957153, 45.21327972, 42.87007141, 37.33061981, 40.35097885, 45.1908493 , 43.75690079, 48.13087845, 34.45660019, 34.45547104, 44.80070114, 33.97882843, 48.57120132, 44.30342102, 34.86135864, 46.09712982, 43.94018936, 45.79737091, 36.51216125, 41.05413055, 44.47146988, 44.95222092, 43.74367142, 41.83383942, 44.32529831, 40.31118011, 48.30577087, 40.06153107, 40.8852005 , 44.60533142, 43.88742828, 44.94306946, 37.71408844, 39.59917068, 44.94966125, 39.13682938, 40.61233139, 33.69144058, 48.87929916, 45.14532089, 36.32677841, 41.37602997, 41.38291168, 39.31917191, 39.80392075, 40.4618187 , 41.7616806 , 39.29148102, 44.62620926, 38.30183029, 44.57923889, 39.45500183, 42.05257034, 42.64580154, 42.07875061, 42.40716934, 39.46138 , 39.76486969, 47.6838913 , 44.50831985, 38.67990112, 37.78971863, 40.88800049, 46.41400146, 41.05615997, 40.95814133, 47.98287964, 44.37667084, 45.42869949, 47.3503685 , 42.9640007 , 44.10771942, 45.16506958, 38.60800171, 44.24766922, 38.94569016, 43.76377106, 44.67887878, 42.16442108, 46.55960083, 44.83052063, 45.3642807 , 45.27190018, 38.50809097, 38.49745941, 45.89107132, 37.67993927, 40.59936142, 36.31575012, 41.35884857, 40.58102036, 48.92755127, 39.08766174, 45.04315186, 39.13399887, 40.84455872, 37.86943054, ... 39.17161942, 39.74103928, 36.58203125, 42.69107819, 41.22869873, 45.07706833, 41.79299927, 40.97851944, 44.78562164, 40.62350082, 39.23802948, 44.14424896, 44.36917114, 48.52753067, 44.81243134, 44.02740097, 39.67712021, 40.42816925, 47.33198166, 44.65567017, 46.34936905, 41.31869888, 43.74901962, 43.22718048, 36.47492981, 41.89833069, 41.88573074, 46.11867905, 40.53742981, 42.69525146, 39.99884033, 36.12778091, 40.6780014 , 37.35327911, 48.0746994 , 43.62902832, 42.76393127, 47.23328018, 40.73899841, 39.30086899, 46.14287186, 46.14379883, 44.15177917, 40.03279114, 39.41550064, 37.72193909, 37.48575974, 38.99076843, 47.28733826, 41.86425018, 37.61497116, 39.44950104, 36.02634811, 39.61676025, 37.48509979, 44.37665176, 39.9366684 , 43.7994194 , 38.07297897, 37.88248062, 47.9199791 , 39.13544846, 39.13241959, 46.27368164, 47.94485092, 41.15945816, 37.57500076, 48.86610031, 37.51976013, 35.77555847, 45.07220078, 44.65866089, 39.00994873, 37.21411133, 44.61088181, 41.00289154, 44.53266907, 35.14202118, 45.04574966, 46.64141846, 39.96450043, 38.9455719 , 37.83633041, 40.2010498 , 33.75835037, 42.75743103, 42.81512833, 40.34703064, 40.43254089, 42.01256943, 42.28020096, 45.06703186, 37.47922134, 44.8041687 , 47.44847107, 33.81241989, 39.13233185, 37.74797058, 43.93225098, 40.79487991]) - elev(site_id)float641.887e+03 2.713e+03 ... 2.847e+03
array([1886.71203613, 2712.7199707 , 2529.84008789, 1066.80004883,
       2255.52001953, 1831.84802246, 3048.        , 3340.60791016,
       1758.69604492, 2310.3840332 , 2103.12011719, 2225.04003906,
       2346.95996094, 2859.02392578, 2781.30004883, 1706.88000488,
       2145.79199219, 1948.58642578, 2514.60009766, 2151.88793945,
       2188.46411133, 2834.63989258, 2267.71191406, 2697.47998047,
       1630.68005371, 2407.91992188, 2450.59204102, 1438.65600586,
       2895.60009766, 1645.92004395, 2767.58398438, 2675.22949219,
       1883.66394043, 2499.36010742, 2852.92797852, 3535.67993164,
       2590.80004883, 2392.67993164, 2435.35205078, 2523.74389648,
       2435.35205078, 1106.4239502 , 1569.7199707 , 2804.15991211,
       2343.60717773, 1820.265625  , 2858.10961914, 3444.23999023,
       1987.29602051, 2102.51049805, 2647.18798828, 1999.48803711,
       3154.37524414, 2435.35205078, 2510.02807617, 1844.04003906,
       2767.58398438, 1563.62402344, 1609.34399414, 2297.27758789,
       3316.22412109, 1499.6159668 , 2490.21606445, 2869.38720703,
       3529.58398438, 2718.81591797, 2197.60791016, 2993.13598633,
       2703.27124023, 1722.11999512, 2980.9440918 , 1112.52001953,
       1292.35205078, 2636.52001953, 2100.07202148, 2316.47998047,
       2458.8215332 , 1789.17602539, 2840.43115234, 1932.43200684,
...
        987.55200195, 3102.86401367, 2582.87524414, 1929.99365234,
       1685.54394531, 3200.39990234, 2651.76000977, 2956.56005859,
       2621.2800293 , 3045.56152344, 3310.12792969,  893.06402588,
       2368.29589844, 2590.80004883, 1670.30395508, 2901.08642578,
       1983.9432373 , 1706.88000488, 1950.7199707 , 2816.35205078,
       3139.43994141, 2620.06079102, 2865.12011719, 3108.95996094,
       3243.07202148, 1319.78405762, 2520.69604492, 3246.12011719,
       2404.87207031, 2836.46875   , 3139.43994141, 3316.22412109,
       1499.6159668 , 2255.82470703, 2731.00805664, 2878.8359375 ,
       3383.2800293 , 1706.88000488, 2055.87597656, 2804.15991211,
       2377.43994141, 1527.04797363, 2819.39990234, 2805.07446289,
       1228.34399414, 3273.55200195, 3389.37597656, 1694.68798828,
       2042.16003418, 3066.28808594, 3115.0559082 , 2072.63989258,
       2727.95996094, 2350.00805664, 2188.46411133, 2651.76000977,
       1353.31201172, 2633.77685547, 2245.46166992, 2938.27197266,
       2913.88793945, 2392.67993164, 1978.15197754, 2462.78393555,
       2907.79199219, 3261.36010742, 2170.17602539, 2407.91992188,
       1716.02404785, 3352.80004883, 2331.7199707 , 1816.60803223,
       2103.12011719, 2842.86962891, 2649.3215332 , 2545.08007812,
       2846.83203125])
- description :
- SNOTEL snow depth measurements
- units :
- inches
wteq_da = get_DataArray(allsites_wteq_df, sites_gdf_all, name="WTEQ_D")
wteq_da
<xarray.DataArray 'WTEQ_D' (time: 21335, site_id: 796)>
array([[ nan,  nan,  nan, ...,  nan,  nan,  nan],
       [ nan,  nan,  nan, ...,  nan,  nan,  nan],
       [ nan,  nan,  nan, ...,  nan,  nan,  nan],
       ...,
       [ 9.8,  6.8, 12.5, ...,  6.1, 11.1, 19.6],
       [ 9.9,  6.7, 12.5, ...,  5.9, 11. , 19.7],
       [ 9.9,  6.7, 12.6, ...,  6.1, 11.1, 19.6]])
Coordinates:
  * time     (time) datetime64[ns] 1963-10-01 1963-10-02 ... 2022-02-27
  * site_id  (site_id) object 'SNOTEL:301_CA_SNTL' ... 'SNOTEL:1033_CO_SNTL'
    lon      (site_id) float64 -120.8 -112.3 -112.0 ... -112.8 -109.8 -106.6
    lat      (site_id) float64 41.24 37.52 45.6 47.78 ... 37.75 43.93 40.79
elev (site_id) float64 1.887e+03 2.713e+03 ... 2.545e+03 2.847e+03- time: 21335
- site_id: 796
- nan nan nan nan nan nan nan nan ... 29.6 8.8 7.4 0.7 7.4 6.1 11.1 19.6
array([[ nan, nan, nan, ..., nan, nan, nan], [ nan, nan, nan, ..., nan, nan, nan], [ nan, nan, nan, ..., nan, nan, nan], ..., [ 9.8, 6.8, 12.5, ..., 6.1, 11.1, 19.6], [ 9.9, 6.7, 12.5, ..., 5.9, 11. , 19.7], [ 9.9, 6.7, 12.6, ..., 6.1, 11.1, 19.6]]) - time(time)datetime64[ns]1963-10-01 ... 2022-02-27
array(['1963-10-01T00:00:00.000000000', '1963-10-02T00:00:00.000000000', '1963-10-03T00:00:00.000000000', ..., '2022-02-25T00:00:00.000000000', '2022-02-26T00:00:00.000000000', '2022-02-27T00:00:00.000000000'], dtype='datetime64[ns]') - site_id(site_id)object'SNOTEL:301_CA_SNTL' ... 'SNOTEL...
array(['SNOTEL:301_CA_SNTL', 'SNOTEL:907_UT_SNTL', 'SNOTEL:916_MT_SNTL', ..., 'SNOTEL:1197_UT_SNTL', 'SNOTEL:878_WY_SNTL', 'SNOTEL:1033_CO_SNTL'], dtype=object) - lon(site_id)float64-120.8 -112.3 ... -109.8 -106.6
array([-120.79192352, -112.2711792 , -111.95902252, -121.69847107, -117.19258118, -122.16517639, -105.06748962, -106.38141632, -119.25392151, -105.76083374, -115.23906708, -113.02317047, -111.40643311, -111.38272095, -107.84442139, -109.50344086, -115.44573212, -115.23446655, -111.60502625, -113.13037872, -110.4454422 , -112.52046967, -106.32128906, -107.26609039, -112.98191071, -116.14292908, -113.93797302, -115.45278168, -122.09380341, -105.6448288 , -116.07447815, -107.009552 , -110.82769775, -116.98097229, -107.06134796, -109.56742859, -107.51212311, -106.5114212 , -111.35852051, -111.55812836, -111.09781647, -109.21656799, -121.25550079, -118.21900177, -109.05711365, -111.94405365, -111.92102814, -114.62277985, -105.77789307, -112.25232697, -115.69309998, -117.1150589 , -115.79560852, -112.35671997, -107.20068359, -119.94219971, -122.85487366, -109.25965118, -123.34393311, -122.26616669, -114.64862823, -107.35681152, -113.99900818, -111.12802887, -111.59764862, -108.18364716, -105.66397095, -113.43094635, -106.71383667, -110.58280182, -114.35430145, -109.79332733, -121.85604858, -120.67960358, -110.60973358, -103.97688293, -113.50099182, -119.92436981, -118.51721954, -112.15348816, ... -118.42617035, -111.85308075, -116.34079742, -110.05780029, -122.42536926, -105.19467926, -111.62957001, -111.56918335, -117.85050201, -106.67680359, -108.89572144, -107.23619843, -105.52713776, -110.94873047, -105.23233032, -120.84929657, -115.43817902, -110.59140015, -120.29412079, -109.67279816, -120.18406677, -114.44754791, -114.50559998, -110.22122192, -105.57614899, -111.24909973, -107.26014709, -106.83535004, -106.75421906, -120.37014771, -111.50602722, -105.37326813, -115.98339844, -106.81362152, -106.38005829, -107.50679779, -116.33660126, -112.41477966, -114.8527298 , -119.23432922, -107.36430359, -112.79087067, -120.21865082, -114.95574951, -113.16400146, -123.42594147, -106.92713928, -112.90155029, -121.78975677, -107.32151794, -105.54250336, -116.45413208, -111.09198761, -114.31021118, -105.12245178, -111.14997864, -106.90847778, -111.41085052, -112.14914703, -109.90986633, -121.38153076, -110.9884491 , -111.88162994, -105.60247803, -109.4797287 , -112.47782898, -110.83515167, -106.09432983, -105.73336792, -115.0027771 , -105.57816315, -118.1519165 , -106.80169678, -109.65699768, -112.81427765, -110.91773224, -111.35684967, -112.77494812, -109.81774902, -106.59535217]) - lat(site_id)float6441.24 37.52 45.6 ... 43.93 40.79
array([41.2358284 , 37.52217102, 45.597229 , 47.77957153, 45.21327972, 42.87007141, 37.33061981, 40.35097885, 45.1908493 , 39.91550064, 43.75690079, 48.13087845, 34.45660019, 34.45547104, 44.80070114, 33.97882843, 48.57120132, 44.30342102, 34.86135864, 46.09712982, 43.94018936, 45.79737091, 36.51216125, 41.05413055, 44.47146988, 44.95222092, 43.74367142, 41.83383942, 44.32529831, 40.31118011, 48.30577087, 40.06153107, 40.8852005 , 44.60533142, 43.88742828, 44.94306946, 37.71408844, 39.59917068, 44.94966125, 39.13682938, 40.61233139, 33.69144058, 48.87929916, 45.14532089, 36.32677841, 41.37602997, 41.38291168, 39.31917191, 39.80392075, 40.4618187 , 41.7616806 , 39.29148102, 44.62620926, 38.30183029, 44.57923889, 39.45500183, 42.05257034, 42.64580154, 42.07875061, 42.40716934, 39.46138 , 39.76486969, 47.6838913 , 44.50831985, 38.67990112, 37.78971863, 40.88800049, 46.41400146, 41.05615997, 40.95814133, 47.98287964, 44.37667084, 45.42869949, 47.3503685 , 42.9640007 , 44.10771942, 45.16506958, 38.60800171, 44.24766922, 38.94569016, 43.76377106, 44.67887878, 42.16442108, 46.55960083, 44.83052063, 45.3642807 , 45.27190018, 38.50809097, 38.49745941, 45.89107132, 37.67993927, 40.59936142, 36.31575012, 41.35884857, 40.58102036, 48.92755127, 39.08766174, 45.04315186, 39.13399887, 40.84455872, ... 36.58203125, 42.69107819, 41.22869873, 45.07706833, 41.79299927, 44.78562164, 40.62350082, 39.23802948, 44.14424896, 44.36917114, 48.52753067, 44.81243134, 44.02740097, 39.67712021, 40.42816925, 47.33198166, 44.65567017, 46.34936905, 41.31869888, 43.74901962, 43.22718048, 36.47492981, 41.89833069, 41.88573074, 46.11867905, 40.53742981, 42.69525146, 39.99884033, 36.12778091, 40.6780014 , 37.35327911, 48.0746994 , 43.62902832, 42.76393127, 47.23328018, 40.73899841, 39.30086899, 46.14287186, 46.14379883, 44.15177917, 40.03279114, 39.41550064, 37.72193909, 37.48575974, 38.99076843, 47.28733826, 41.86425018, 37.61497116, 39.44950104, 36.02634811, 39.61676025, 37.48509979, 44.37665176, 39.9366684 , 43.7994194 , 38.07297897, 37.88248062, 47.9199791 , 39.13544846, 39.13241959, 46.27368164, 47.94485092, 41.15945816, 37.57500076, 48.86610031, 37.51976013, 35.77555847, 45.07220078, 44.65866089, 39.00994873, 37.21411133, 44.61088181, 41.00289154, 44.53266907, 35.14202118, 45.04574966, 46.64141846, 39.96450043, 37.83633041, 40.2010498 , 33.75835037, 42.75743103, 42.81512833, 40.34703064, 40.43254089, 42.01256943, 42.28020096, 45.06703186, 37.47922134, 44.8041687 , 47.44847107, 33.81241989, 39.13233185, 37.74797058, 43.93225098, 40.79487991]) - elev(site_id)float641.887e+03 2.713e+03 ... 2.847e+03
array([1886.71203613, 2712.7199707 , 2529.84008789, 1066.80004883,
       2255.52001953, 1831.84802246, 3048.        , 3340.60791016,
       1758.69604492, 2950.46411133, 2310.3840332 , 2103.12011719,
       2225.04003906, 2346.95996094, 2859.02392578, 2781.30004883,
       1706.88000488, 2145.79199219, 1948.58642578, 2514.60009766,
       2151.88793945, 2188.46411133, 2834.63989258, 2267.71191406,
       2697.47998047, 1630.68005371, 2407.91992188, 2450.59204102,
       1438.65600586, 2895.60009766, 1645.92004395, 2767.58398438,
       2675.22949219, 1883.66394043, 2499.36010742, 2852.92797852,
       3535.67993164, 2590.80004883, 2392.67993164, 2435.35205078,
       2523.74389648, 2435.35205078, 1106.4239502 , 1569.7199707 ,
       2804.15991211, 2343.60717773, 1820.265625  , 2858.10961914,
       3444.23999023, 1987.29602051, 2102.51049805, 2647.18798828,
       1999.48803711, 3154.37524414, 2435.35205078, 2510.02807617,
       1844.04003906, 2767.58398438, 1563.62402344, 1609.34399414,
       2297.27758789, 3316.22412109, 1499.6159668 , 2490.21606445,
       2869.38720703, 3529.58398438, 2718.81591797, 2197.60791016,
       2993.13598633, 2703.27124023, 1722.11999512, 2980.9440918 ,
       1112.52001953, 1292.35205078, 2636.52001953, 2100.07202148,
       2316.47998047, 2458.8215332 , 1789.17602539, 2840.43115234,
...
       1569.7199707 , 2097.02392578, 2346.95996094, 2919.98388672,
        987.55200195, 3102.86401367, 2582.87524414, 1929.99365234,
       1685.54394531, 3200.39990234, 2651.76000977, 2956.56005859,
       2621.2800293 , 3045.56152344, 3310.12792969,  893.06402588,
       2368.29589844, 2590.80004883, 1670.30395508, 2901.08642578,
       1983.9432373 , 1706.88000488, 1950.7199707 , 2816.35205078,
       3139.43994141, 2620.06079102, 2865.12011719, 3108.95996094,
       3243.07202148, 1319.78405762, 2520.69604492, 3246.12011719,
       2404.87207031, 2836.46875   , 3139.43994141, 3316.22412109,
       1499.6159668 , 2255.82470703, 2731.00805664, 2878.8359375 ,
       3383.2800293 , 1706.88000488, 2055.87597656, 2804.15991211,
       2377.43994141, 1527.04797363, 2819.39990234, 2805.07446289,
       1228.34399414, 3273.55200195, 3389.37597656, 1694.68798828,
       2042.16003418, 3066.28808594, 3115.0559082 , 2072.63989258,
       2727.95996094, 2350.00805664, 2188.46411133, 2651.76000977,
       1353.31201172, 2633.77685547, 2938.27197266, 2913.88793945,
       2392.67993164, 1978.15197754, 2462.78393555, 2907.79199219,
       3261.36010742, 2170.17602539, 2407.91992188, 1716.02404785,
       3352.80004883, 2331.7199707 , 1816.60803223, 2103.12011719,
       2842.86962891, 2649.3215332 , 2545.08007812, 2846.83203125])
wteq_da.attrs['units'] = 'inches w.e.'
wteq_da.attrs['description'] = 'SNOTEL snow water equivalent measurements'
wteq_da
<xarray.DataArray 'WTEQ_D' (time: 21335, site_id: 796)>
array([[ nan,  nan,  nan, ...,  nan,  nan,  nan],
       [ nan,  nan,  nan, ...,  nan,  nan,  nan],
       [ nan,  nan,  nan, ...,  nan,  nan,  nan],
       ...,
       [ 9.8,  6.8, 12.5, ...,  6.1, 11.1, 19.6],
       [ 9.9,  6.7, 12.5, ...,  5.9, 11. , 19.7],
       [ 9.9,  6.7, 12.6, ...,  6.1, 11.1, 19.6]])
Coordinates:
  * time     (time) datetime64[ns] 1963-10-01 1963-10-02 ... 2022-02-27
  * site_id  (site_id) object 'SNOTEL:301_CA_SNTL' ... 'SNOTEL:1033_CO_SNTL'
    lon      (site_id) float64 -120.8 -112.3 -112.0 ... -112.8 -109.8 -106.6
    lat      (site_id) float64 41.24 37.52 45.6 47.78 ... 37.75 43.93 40.79
    elev     (site_id) float64 1.887e+03 2.713e+03 ... 2.545e+03 2.847e+03
Attributes:
    units:        inches w.e.
description: SNOTEL snow water equivalent measurements- time: 21335
- site_id: 796
- nan nan nan nan nan nan nan nan ... 29.6 8.8 7.4 0.7 7.4 6.1 11.1 19.6
array([[ nan, nan, nan, ..., nan, nan, nan], [ nan, nan, nan, ..., nan, nan, nan], [ nan, nan, nan, ..., nan, nan, nan], ..., [ 9.8, 6.8, 12.5, ..., 6.1, 11.1, 19.6], [ 9.9, 6.7, 12.5, ..., 5.9, 11. , 19.7], [ 9.9, 6.7, 12.6, ..., 6.1, 11.1, 19.6]]) - time(time)datetime64[ns]1963-10-01 ... 2022-02-27
array(['1963-10-01T00:00:00.000000000', '1963-10-02T00:00:00.000000000', '1963-10-03T00:00:00.000000000', ..., '2022-02-25T00:00:00.000000000', '2022-02-26T00:00:00.000000000', '2022-02-27T00:00:00.000000000'], dtype='datetime64[ns]') - site_id(site_id)object'SNOTEL:301_CA_SNTL' ... 'SNOTEL...
array(['SNOTEL:301_CA_SNTL', 'SNOTEL:907_UT_SNTL', 'SNOTEL:916_MT_SNTL', ..., 'SNOTEL:1197_UT_SNTL', 'SNOTEL:878_WY_SNTL', 'SNOTEL:1033_CO_SNTL'], dtype=object) - lon(site_id)float64-120.8 -112.3 ... -109.8 -106.6
array([-120.79192352, -112.2711792 , -111.95902252, -121.69847107, -117.19258118, -122.16517639, -105.06748962, -106.38141632, -119.25392151, -105.76083374, -115.23906708, -113.02317047, -111.40643311, -111.38272095, -107.84442139, -109.50344086, -115.44573212, -115.23446655, -111.60502625, -113.13037872, -110.4454422 , -112.52046967, -106.32128906, -107.26609039, -112.98191071, -116.14292908, -113.93797302, -115.45278168, -122.09380341, -105.6448288 , -116.07447815, -107.009552 , -110.82769775, -116.98097229, -107.06134796, -109.56742859, -107.51212311, -106.5114212 , -111.35852051, -111.55812836, -111.09781647, -109.21656799, -121.25550079, -118.21900177, -109.05711365, -111.94405365, -111.92102814, -114.62277985, -105.77789307, -112.25232697, -115.69309998, -117.1150589 , -115.79560852, -112.35671997, -107.20068359, -119.94219971, -122.85487366, -109.25965118, -123.34393311, -122.26616669, -114.64862823, -107.35681152, -113.99900818, -111.12802887, -111.59764862, -108.18364716, -105.66397095, -113.43094635, -106.71383667, -110.58280182, -114.35430145, -109.79332733, -121.85604858, -120.67960358, -110.60973358, -103.97688293, -113.50099182, -119.92436981, -118.51721954, -112.15348816, ... -118.42617035, -111.85308075, -116.34079742, -110.05780029, -122.42536926, -105.19467926, -111.62957001, -111.56918335, -117.85050201, -106.67680359, -108.89572144, -107.23619843, -105.52713776, -110.94873047, -105.23233032, -120.84929657, -115.43817902, -110.59140015, -120.29412079, -109.67279816, -120.18406677, -114.44754791, -114.50559998, -110.22122192, -105.57614899, -111.24909973, -107.26014709, -106.83535004, -106.75421906, -120.37014771, -111.50602722, -105.37326813, -115.98339844, -106.81362152, -106.38005829, -107.50679779, -116.33660126, -112.41477966, -114.8527298 , -119.23432922, -107.36430359, -112.79087067, -120.21865082, -114.95574951, -113.16400146, -123.42594147, -106.92713928, -112.90155029, -121.78975677, -107.32151794, -105.54250336, -116.45413208, -111.09198761, -114.31021118, -105.12245178, -111.14997864, -106.90847778, -111.41085052, -112.14914703, -109.90986633, -121.38153076, -110.9884491 , -111.88162994, -105.60247803, -109.4797287 , -112.47782898, -110.83515167, -106.09432983, -105.73336792, -115.0027771 , -105.57816315, -118.1519165 , -106.80169678, -109.65699768, -112.81427765, -110.91773224, -111.35684967, -112.77494812, -109.81774902, -106.59535217]) - lat(site_id)float6441.24 37.52 45.6 ... 43.93 40.79
array([41.2358284 , 37.52217102, 45.597229 , 47.77957153, 45.21327972, 42.87007141, 37.33061981, 40.35097885, 45.1908493 , 39.91550064, 43.75690079, 48.13087845, 34.45660019, 34.45547104, 44.80070114, 33.97882843, 48.57120132, 44.30342102, 34.86135864, 46.09712982, 43.94018936, 45.79737091, 36.51216125, 41.05413055, 44.47146988, 44.95222092, 43.74367142, 41.83383942, 44.32529831, 40.31118011, 48.30577087, 40.06153107, 40.8852005 , 44.60533142, 43.88742828, 44.94306946, 37.71408844, 39.59917068, 44.94966125, 39.13682938, 40.61233139, 33.69144058, 48.87929916, 45.14532089, 36.32677841, 41.37602997, 41.38291168, 39.31917191, 39.80392075, 40.4618187 , 41.7616806 , 39.29148102, 44.62620926, 38.30183029, 44.57923889, 39.45500183, 42.05257034, 42.64580154, 42.07875061, 42.40716934, 39.46138 , 39.76486969, 47.6838913 , 44.50831985, 38.67990112, 37.78971863, 40.88800049, 46.41400146, 41.05615997, 40.95814133, 47.98287964, 44.37667084, 45.42869949, 47.3503685 , 42.9640007 , 44.10771942, 45.16506958, 38.60800171, 44.24766922, 38.94569016, 43.76377106, 44.67887878, 42.16442108, 46.55960083, 44.83052063, 45.3642807 , 45.27190018, 38.50809097, 38.49745941, 45.89107132, 37.67993927, 40.59936142, 36.31575012, 41.35884857, 40.58102036, 48.92755127, 39.08766174, 45.04315186, 39.13399887, 40.84455872, ... 36.58203125, 42.69107819, 41.22869873, 45.07706833, 41.79299927, 44.78562164, 40.62350082, 39.23802948, 44.14424896, 44.36917114, 48.52753067, 44.81243134, 44.02740097, 39.67712021, 40.42816925, 47.33198166, 44.65567017, 46.34936905, 41.31869888, 43.74901962, 43.22718048, 36.47492981, 41.89833069, 41.88573074, 46.11867905, 40.53742981, 42.69525146, 39.99884033, 36.12778091, 40.6780014 , 37.35327911, 48.0746994 , 43.62902832, 42.76393127, 47.23328018, 40.73899841, 39.30086899, 46.14287186, 46.14379883, 44.15177917, 40.03279114, 39.41550064, 37.72193909, 37.48575974, 38.99076843, 47.28733826, 41.86425018, 37.61497116, 39.44950104, 36.02634811, 39.61676025, 37.48509979, 44.37665176, 39.9366684 , 43.7994194 , 38.07297897, 37.88248062, 47.9199791 , 39.13544846, 39.13241959, 46.27368164, 47.94485092, 41.15945816, 37.57500076, 48.86610031, 37.51976013, 35.77555847, 45.07220078, 44.65866089, 39.00994873, 37.21411133, 44.61088181, 41.00289154, 44.53266907, 35.14202118, 45.04574966, 46.64141846, 39.96450043, 37.83633041, 40.2010498 , 33.75835037, 42.75743103, 42.81512833, 40.34703064, 40.43254089, 42.01256943, 42.28020096, 45.06703186, 37.47922134, 44.8041687 , 47.44847107, 33.81241989, 39.13233185, 37.74797058, 43.93225098, 40.79487991]) - elev(site_id)float641.887e+03 2.713e+03 ... 2.847e+03
array([1886.71203613, 2712.7199707 , 2529.84008789, 1066.80004883,
       2255.52001953, 1831.84802246, 3048.        , 3340.60791016,
       1758.69604492, 2950.46411133, 2310.3840332 , 2103.12011719,
       2225.04003906, 2346.95996094, 2859.02392578, 2781.30004883,
       1706.88000488, 2145.79199219, 1948.58642578, 2514.60009766,
       2151.88793945, 2188.46411133, 2834.63989258, 2267.71191406,
       2697.47998047, 1630.68005371, 2407.91992188, 2450.59204102,
       1438.65600586, 2895.60009766, 1645.92004395, 2767.58398438,
       2675.22949219, 1883.66394043, 2499.36010742, 2852.92797852,
       3535.67993164, 2590.80004883, 2392.67993164, 2435.35205078,
       2523.74389648, 2435.35205078, 1106.4239502 , 1569.7199707 ,
       2804.15991211, 2343.60717773, 1820.265625  , 2858.10961914,
       3444.23999023, 1987.29602051, 2102.51049805, 2647.18798828,
       1999.48803711, 3154.37524414, 2435.35205078, 2510.02807617,
       1844.04003906, 2767.58398438, 1563.62402344, 1609.34399414,
       2297.27758789, 3316.22412109, 1499.6159668 , 2490.21606445,
       2869.38720703, 3529.58398438, 2718.81591797, 2197.60791016,
       2993.13598633, 2703.27124023, 1722.11999512, 2980.9440918 ,
       1112.52001953, 1292.35205078, 2636.52001953, 2100.07202148,
       2316.47998047, 2458.8215332 , 1789.17602539, 2840.43115234,
...
       1569.7199707 , 2097.02392578, 2346.95996094, 2919.98388672,
        987.55200195, 3102.86401367, 2582.87524414, 1929.99365234,
       1685.54394531, 3200.39990234, 2651.76000977, 2956.56005859,
       2621.2800293 , 3045.56152344, 3310.12792969,  893.06402588,
       2368.29589844, 2590.80004883, 1670.30395508, 2901.08642578,
       1983.9432373 , 1706.88000488, 1950.7199707 , 2816.35205078,
       3139.43994141, 2620.06079102, 2865.12011719, 3108.95996094,
       3243.07202148, 1319.78405762, 2520.69604492, 3246.12011719,
       2404.87207031, 2836.46875   , 3139.43994141, 3316.22412109,
       1499.6159668 , 2255.82470703, 2731.00805664, 2878.8359375 ,
       3383.2800293 , 1706.88000488, 2055.87597656, 2804.15991211,
       2377.43994141, 1527.04797363, 2819.39990234, 2805.07446289,
       1228.34399414, 3273.55200195, 3389.37597656, 1694.68798828,
       2042.16003418, 3066.28808594, 3115.0559082 , 2072.63989258,
       2727.95996094, 2350.00805664, 2188.46411133, 2651.76000977,
       1353.31201172, 2633.77685547, 2938.27197266, 2913.88793945,
       2392.67993164, 1978.15197754, 2462.78393555, 2907.79199219,
       3261.36010742, 2170.17602539, 2407.91992188, 1716.02404785,
       3352.80004883, 2331.7199707 , 1816.60803223, 2103.12011719,
       2842.86962891, 2649.3215332 , 2545.08007812, 2846.83203125])
- units :
- inches w.e.
- description :
- SNOTEL snow water equivalent measurements
Merge the two DataArrays into a single DataSet
ds = xr.merge([snwd_da, wteq_da])
ds
<xarray.Dataset>
Dimensions:  (time: 21335, site_id: 808)
Coordinates:
  * time     (time) datetime64[ns] 1963-10-01 1963-10-02 ... 2022-02-27
  * site_id  (site_id) object 'SNOTEL:1000_OR_SNTL' ... 'SNOTEL:999_WA_SNTL'
    lon      (site_id) float64 -122.2 -105.4 -116.9 ... -110.8 -121.4 -121.7
    lat      (site_id) float64 42.87 37.61 40.36 46.91 ... 40.89 48.86 48.76
    elev     (site_id) float64 1.832e+03 3.246e+03 ... 1.606e+03 1.073e+03
Data variables:
    SNWD_D   (time, site_id) float64 nan nan nan nan nan ... nan nan nan nan nan
    WTEQ_D   (time, site_id) float64 nan nan nan nan nan ... nan 6.8 75.0 40.6
Attributes:
    description:  SNOTEL snow depth measurements
units: inches- time: 21335
- site_id: 808
- time(time)datetime64[ns]1963-10-01 ... 2022-02-27
array(['1963-10-01T00:00:00.000000000', '1963-10-02T00:00:00.000000000', '1963-10-03T00:00:00.000000000', ..., '2022-02-25T00:00:00.000000000', '2022-02-26T00:00:00.000000000', '2022-02-27T00:00:00.000000000'], dtype='datetime64[ns]') - site_id(site_id)object'SNOTEL:1000_OR_SNTL' ... 'SNOTE...
array(['SNOTEL:1000_OR_SNTL', 'SNOTEL:1005_CO_SNTL', 'SNOTEL:1006_NV_SNTL', ..., 'SNOTEL:992_UT_SNTL', 'SNOTEL:998_WA_SNTL', 'SNOTEL:999_WA_SNTL'], dtype=object) - lon(site_id)float64-122.2 -105.4 ... -121.4 -121.7
array([-122.16517639, -105.37326813, -116.86492157, -110.85359955, -110.90197754, -120.94917297, -121.92951202, -122.184021 , -111.54605103, -106.02729797, -107.25717163, -116.08878326, -106.81362152, -106.38141632, -105.95583344, -106.00759888, -106.59535217, -105.78721619, -116.63925934, -111.60991669, -106.54128265, -106.5114212 , -105.60247803, -118.39842987, -122.42536926, -105.38278198, -106.2309494 , -106.94283295, -107.86975098, -119.95970154, -119.88732147, -119.89420319, -119.53521729, -116.46311951, -111.8170166 , -111.48747253, -105.07366943, -106.53782654, -106.59883118, -108.11373138, -107.009552 , -113.94235229, -113.45987701, -120.00219727, -121.42172241, -121.77971649, -121.68002319, -121.97714996, -117.94882965, -121.1971283 , -117.03666687, -110.92783356, -105.52713776, -123.27562714, -121.53430176, -110.43395233, -111.50602722, -112.1678772 , -106.36801147, -106.62931061, -105.85050201, -121.95555115, -110.08019257, -110.71250153, -123.45747375, -122.21633148, -115.6297226 , -115.69542694, -115.67507935, -111.56918335, -111.46929932, -111.59712982, -110.35289764, -110.00527191, -111.35946655, -106.71383667, -106.42459869, -111.74485779, -105.63067627, -105.76560211, ... -115.0027771 , -105.57816315, -118.1519165 , -106.80169678, -109.65699768, -112.81427765, -110.91773224, -109.81774902, -111.85308075, -114.41812134, -111.71865082, -121.4719696 , -121.56812286, -121.46974945, -113.92664337, -109.21656799, -112.50787354, -108.02445221, -108.16954041, -112.1734314 , -112.2711792 , -121.69847107, -121.78975677, -121.90892792, -121.60475159, -121.61006927, -106.59528351, -105.43614197, -113.83731842, -111.95902252, -109.64727783, -115.81915283, -110.33022308, -103.7875824 , -105.80674744, -105.78333282, -108.90273285, -111.09198761, -122.03125 , -113.83402252, -111.65058136, -121.58778381, -110.92783356, -113.30792236, -107.20068359, -115.62332916, -108.26667023, -105.19467926, -105.80000305, -105.59345245, -105.91078186, -106.11306763, -106.08332825, -106.74835205, -121.95231628, -121.94032288, -123.07879639, -109.87815094, -121.13339996, -111.41207123, -105.90622711, -111.8137207 , -111.76457214, -123.42594147, -120.78266907, -120.75202179, -116.09684753, -116.33660126, -109.45960999, -104.41056824, -111.8335495 , -117.54154968, -117.39437866, -116.75747681, -116.85350037, -121.25550079, -121.07975769, -110.82769775, -121.43894958, -121.69822693]) - lat(site_id)float6442.87 37.61 40.36 ... 48.86 48.76
array([42.87007141, 37.61497116, 40.35757065, 46.91347885, 46.92689896, 42.63809967, 48.82453156, 46.16379929, 41.79299927, 39.79560089, 41.40100098, 44.78834915, 36.02634811, 40.35097885, 40.40404892, 40.70750046, 40.79487991, 33.40472031, 48.37430954, 40.28300095, 39.60467911, 39.59917068, 40.2010498 , 48.86132812, 43.22718048, 41.22869873, 41.23836899, 41.07052994, 33.00812149, 38.68244934, 38.83652115, 38.71942902, 38.39746857, 48.72262955, 40.99200058, 41.3588295 , 38.8758316 , 37.47032928, 38.16283035, 37.50357056, 40.06153107, 37.49617004, 37.40082932, 38.69269943, 47.15991974, 47.20172119, 42.4132309 , 42.78636932, 45.98210144, 48.92755127, 47.85583115, 43.77933121, 36.12778091, 45.24755096, 46.86954117, 39.67712021, 41.86425018, 38.07125092, 38.69977951, 39.26216888, 38.29325867, 46.10242081, 45.50381088, 46.48450089, 47.70859909, 45.90362167, 36.2492981 , 36.31575012, 36.30537033, 41.88573074, 41.92150116, 41.96768951, 40.55020142, 40.83868027, 41.22154999, 41.05615997, 39.86399841, 35.26805878, 40.57912827, 40.51229858, 37.96660995, 34.96963882, 33.89746857, 38.28554916, 45.99076843, 43.67480087, 44.54315186, 44.34846878, 42.71210098, 42.58010101, 40.9849205 , 41.31869888, 39.44950104, 36.17728043, 35.26247025, 34.45547104, 38.99076843, 46.49597168, 36.32677841, 47.98287964, ... 41.15945816, 37.57500076, 35.77555847, 45.07220078, 37.21411133, 44.61088181, 41.00289154, 44.53266907, 35.14202118, 45.04574966, 46.64141846, 39.96450043, 37.83633041, 33.75835037, 42.75743103, 42.81512833, 40.34703064, 40.43254089, 42.01256943, 42.28020096, 45.06703186, 37.47922134, 44.8041687 , 47.44847107, 33.81241989, 43.93225098, 46.34936905, 43.76850128, 40.86832809, 47.2831192 , 47.35768127, 47.33198166, 46.99523163, 33.69144058, 46.84233856, 37.4414711 , 37.43087006, 40.56533051, 37.52217102, 47.77957153, 48.86610031, 48.69092178, 47.30218124, 47.68432999, 40.22861099, 37.85163879, 44.84617996, 45.597229 , 48.1747818 , 48.97523117, 46.6685791 , 44.20616913, 35.70429993, 35.76694107, 42.59075928, 44.65866089, 45.44575119, 43.72718048, 35.34159851, 47.06565094, 45.87395096, 46.1258812 , 44.57923889, 48.12672043, 35.23332977, 36.47492981, 39.56666946, 39.65626907, 39.43576813, 39.30350113, 39.03332901, 40.81587982, 46.92832947, 47.04439926, 47.87223816, 43.38331985, 42.20619965, 34.74597931, 39.76449966, 40.93416977, 40.8303299 , 47.94485092, 48.57141876, 41.89318085, 43.76377106, 44.37665176, 45.24010086, 44.4863205 , 37.97249985, 46.18286896, 46.2371788 , 48.89369965, 46.80500031, 48.87929916, 48.98075104, 40.8852005 , 48.85932922, 48.76292038]) - elev(site_id)float641.832e+03 3.246e+03 ... 1.073e+03
array([1831.84802246, 3246.12011719, 2255.52001953, 2258.56811523,
       1996.43994141, 1883.66394043, 1514.85595703, 1353.31201172,
       2257.34887695, 2724.91210938, 2392.67993164, 1490.4720459 ,
       2836.46875   , 3340.60791016, 3133.34399414, 2749.29589844,
       2846.83203125, 3133.34399414, 1862.32800293, 2369.51513672,
       2889.50390625, 2590.80004883, 2913.88793945, 1426.46398926,
        987.55200195, 2538.98388672, 2918.15527344, 2717.29199219,
       2816.35205078, 2443.58154297, 2608.17358398, 2477.71923828,
       2838.60229492, 1072.89599609, 2066.23925781, 2503.93188477,
       3493.00805664, 3541.77587891, 3054.09594727, 3267.45605469,
       2767.58398438, 2061.36230469, 2536.5456543 , 2548.12792969,
       1414.27197266, 1188.7199707 , 2081.78393555, 1645.92004395,
       1700.78405762, 1776.98400879, 1283.20800781, 2822.44799805,
       2621.2800293 ,  128.01600647, 1597.15197754, 2662.73291016,
       2520.69604492, 2971.49511719, 3212.59204102, 3081.52807617,
       3267.45605469,  652.27197266, 1930.90795898, 2316.47998047,
       1484.37597656,  762.        , 2395.72802734, 2709.67211914,
       2629.20483398, 1929.99365234, 2348.48388672, 2209.80004883,
       2579.82714844, 3119.62792969, 1853.7935791 , 2993.13598633,
       3206.49609375, 2240.2800293 , 2859.02392578, 3041.90405273,
...
       2170.17602539, 2407.91992188, 1716.02404785, 3352.80004883,
       2331.7199707 , 1816.60803223, 2103.12011719, 2545.08007812,
       2097.02392578, 1923.28796387, 2209.80004883,  984.50402832,
        890.01599121,  911.35198975, 2255.52001953, 2435.35205078,
       2139.69604492, 3287.26806641, 3048.        , 2161.94628906,
       2712.7199707 , 1066.80004883, 1228.34399414,  926.59197998,
       1161.28796387, 1008.88800049, 2816.35205078, 2941.01513672,
       2630.42407227, 2529.84008789, 1432.56005859, 1295.40002441,
       2316.47998047, 1868.4239502 , 2502.40795898, 3488.43603516,
       2956.56005859, 2042.16003418,  819.9119873 , 2901.69604492,
       2965.70410156,  685.79998779, 1996.43994141, 2194.56005859,
       2435.35205078, 1554.47998047, 2578.60791016, 3102.86401367,
       3340.60791016, 3230.87988281, 3230.87988281, 3398.52001953,
       3157.72802734, 2840.73608398,  963.16802979, 1271.01599121,
       1222.24804688, 2993.13598633, 1490.4720459 , 2325.62402344,
       3169.91992188, 2359.15209961, 2042.16003418, 1527.04797363,
       1197.86401367, 1575.81604004, 1932.43200684, 1499.6159668 ,
       1792.22399902, 1801.36804199, 3062.93530273, 1737.35998535,
       1219.19995117, 1536.1920166 , 1432.56005859, 1106.4239502 ,
        515.11199951, 2675.22949219, 1606.29602051, 1072.89599609])
- SNWD_D(time, site_id)float64nan nan nan nan ... nan nan nan nan
- description :
- SNOTEL snow depth measurements
- units :
- inches
array([[nan, nan, nan, ..., nan, nan, nan], [nan, nan, nan, ..., nan, nan, nan], [nan, nan, nan, ..., nan, nan, nan], ..., [nan, nan, nan, ..., nan, nan, nan], [nan, nan, nan, ..., nan, nan, nan], [nan, nan, nan, ..., nan, nan, nan]]) - WTEQ_D(time, site_id)float64nan nan nan nan ... 6.8 75.0 40.6
- units :
- inches w.e.
- description :
- SNOTEL snow water equivalent measurements
array([[ nan,  nan,  nan, ...,  nan,  nan,  nan],
       [ nan,  nan,  nan, ...,  nan,  nan,  nan],
       [ nan,  nan,  nan, ...,  nan,  nan,  nan],
       ...,
       [17. ,  7.3,  6. , ...,  6.8, 73.9, 39.2],
       [17.1,  7.4,  6. , ...,  6.8, 74. , 39.4],
       [17.2,  7.3,  6. , ...,  6.8, 75. , 40.6]])
- description :
- SNOTEL snow depth measurements
- units :
- inches
ds.attrs = {}
ds
<xarray.Dataset>
Dimensions:  (time: 21335, site_id: 808)
Coordinates:
  * time     (time) datetime64[ns] 1963-10-01 1963-10-02 ... 2022-02-27
  * site_id  (site_id) object 'SNOTEL:1000_OR_SNTL' ... 'SNOTEL:999_WA_SNTL'
    lon      (site_id) float64 -122.2 -105.4 -116.9 ... -110.8 -121.4 -121.7
    lat      (site_id) float64 42.87 37.61 40.36 46.91 ... 40.89 48.86 48.76
    elev     (site_id) float64 1.832e+03 3.246e+03 ... 1.606e+03 1.073e+03
Data variables:
    SNWD_D   (time, site_id) float64 nan nan nan nan nan ... nan nan nan nan nan
WTEQ_D (time, site_id) float64 nan nan nan nan nan ... nan 6.8 75.0 40.6- time: 21335
- site_id: 808
- time(time)datetime64[ns]1963-10-01 ... 2022-02-27
array(['1963-10-01T00:00:00.000000000', '1963-10-02T00:00:00.000000000', '1963-10-03T00:00:00.000000000', ..., '2022-02-25T00:00:00.000000000', '2022-02-26T00:00:00.000000000', '2022-02-27T00:00:00.000000000'], dtype='datetime64[ns]') - site_id(site_id)object'SNOTEL:1000_OR_SNTL' ... 'SNOTE...
array(['SNOTEL:1000_OR_SNTL', 'SNOTEL:1005_CO_SNTL', 'SNOTEL:1006_NV_SNTL', ..., 'SNOTEL:992_UT_SNTL', 'SNOTEL:998_WA_SNTL', 'SNOTEL:999_WA_SNTL'], dtype=object) - lon(site_id)float64-122.2 -105.4 ... -121.4 -121.7
array([-122.16517639, -105.37326813, -116.86492157, -110.85359955, -110.90197754, -120.94917297, -121.92951202, -122.184021 , -111.54605103, -106.02729797, -107.25717163, -116.08878326, -106.81362152, -106.38141632, -105.95583344, -106.00759888, -106.59535217, -105.78721619, -116.63925934, -111.60991669, -106.54128265, -106.5114212 , -105.60247803, -118.39842987, -122.42536926, -105.38278198, -106.2309494 , -106.94283295, -107.86975098, -119.95970154, -119.88732147, -119.89420319, -119.53521729, -116.46311951, -111.8170166 , -111.48747253, -105.07366943, -106.53782654, -106.59883118, -108.11373138, -107.009552 , -113.94235229, -113.45987701, -120.00219727, -121.42172241, -121.77971649, -121.68002319, -121.97714996, -117.94882965, -121.1971283 , -117.03666687, -110.92783356, -105.52713776, -123.27562714, -121.53430176, -110.43395233, -111.50602722, -112.1678772 , -106.36801147, -106.62931061, -105.85050201, -121.95555115, -110.08019257, -110.71250153, -123.45747375, -122.21633148, -115.6297226 , -115.69542694, -115.67507935, -111.56918335, -111.46929932, -111.59712982, -110.35289764, -110.00527191, -111.35946655, -106.71383667, -106.42459869, -111.74485779, -105.63067627, -105.76560211, ... -115.0027771 , -105.57816315, -118.1519165 , -106.80169678, -109.65699768, -112.81427765, -110.91773224, -109.81774902, -111.85308075, -114.41812134, -111.71865082, -121.4719696 , -121.56812286, -121.46974945, -113.92664337, -109.21656799, -112.50787354, -108.02445221, -108.16954041, -112.1734314 , -112.2711792 , -121.69847107, -121.78975677, -121.90892792, -121.60475159, -121.61006927, -106.59528351, -105.43614197, -113.83731842, -111.95902252, -109.64727783, -115.81915283, -110.33022308, -103.7875824 , -105.80674744, -105.78333282, -108.90273285, -111.09198761, -122.03125 , -113.83402252, -111.65058136, -121.58778381, -110.92783356, -113.30792236, -107.20068359, -115.62332916, -108.26667023, -105.19467926, -105.80000305, -105.59345245, -105.91078186, -106.11306763, -106.08332825, -106.74835205, -121.95231628, -121.94032288, -123.07879639, -109.87815094, -121.13339996, -111.41207123, -105.90622711, -111.8137207 , -111.76457214, -123.42594147, -120.78266907, -120.75202179, -116.09684753, -116.33660126, -109.45960999, -104.41056824, -111.8335495 , -117.54154968, -117.39437866, -116.75747681, -116.85350037, -121.25550079, -121.07975769, -110.82769775, -121.43894958, -121.69822693]) - lat(site_id)float6442.87 37.61 40.36 ... 48.86 48.76
array([42.87007141, 37.61497116, 40.35757065, 46.91347885, 46.92689896, 42.63809967, 48.82453156, 46.16379929, 41.79299927, 39.79560089, 41.40100098, 44.78834915, 36.02634811, 40.35097885, 40.40404892, 40.70750046, 40.79487991, 33.40472031, 48.37430954, 40.28300095, 39.60467911, 39.59917068, 40.2010498 , 48.86132812, 43.22718048, 41.22869873, 41.23836899, 41.07052994, 33.00812149, 38.68244934, 38.83652115, 38.71942902, 38.39746857, 48.72262955, 40.99200058, 41.3588295 , 38.8758316 , 37.47032928, 38.16283035, 37.50357056, 40.06153107, 37.49617004, 37.40082932, 38.69269943, 47.15991974, 47.20172119, 42.4132309 , 42.78636932, 45.98210144, 48.92755127, 47.85583115, 43.77933121, 36.12778091, 45.24755096, 46.86954117, 39.67712021, 41.86425018, 38.07125092, 38.69977951, 39.26216888, 38.29325867, 46.10242081, 45.50381088, 46.48450089, 47.70859909, 45.90362167, 36.2492981 , 36.31575012, 36.30537033, 41.88573074, 41.92150116, 41.96768951, 40.55020142, 40.83868027, 41.22154999, 41.05615997, 39.86399841, 35.26805878, 40.57912827, 40.51229858, 37.96660995, 34.96963882, 33.89746857, 38.28554916, 45.99076843, 43.67480087, 44.54315186, 44.34846878, 42.71210098, 42.58010101, 40.9849205 , 41.31869888, 39.44950104, 36.17728043, 35.26247025, 34.45547104, 38.99076843, 46.49597168, 36.32677841, 47.98287964, ... 41.15945816, 37.57500076, 35.77555847, 45.07220078, 37.21411133, 44.61088181, 41.00289154, 44.53266907, 35.14202118, 45.04574966, 46.64141846, 39.96450043, 37.83633041, 33.75835037, 42.75743103, 42.81512833, 40.34703064, 40.43254089, 42.01256943, 42.28020096, 45.06703186, 37.47922134, 44.8041687 , 47.44847107, 33.81241989, 43.93225098, 46.34936905, 43.76850128, 40.86832809, 47.2831192 , 47.35768127, 47.33198166, 46.99523163, 33.69144058, 46.84233856, 37.4414711 , 37.43087006, 40.56533051, 37.52217102, 47.77957153, 48.86610031, 48.69092178, 47.30218124, 47.68432999, 40.22861099, 37.85163879, 44.84617996, 45.597229 , 48.1747818 , 48.97523117, 46.6685791 , 44.20616913, 35.70429993, 35.76694107, 42.59075928, 44.65866089, 45.44575119, 43.72718048, 35.34159851, 47.06565094, 45.87395096, 46.1258812 , 44.57923889, 48.12672043, 35.23332977, 36.47492981, 39.56666946, 39.65626907, 39.43576813, 39.30350113, 39.03332901, 40.81587982, 46.92832947, 47.04439926, 47.87223816, 43.38331985, 42.20619965, 34.74597931, 39.76449966, 40.93416977, 40.8303299 , 47.94485092, 48.57141876, 41.89318085, 43.76377106, 44.37665176, 45.24010086, 44.4863205 , 37.97249985, 46.18286896, 46.2371788 , 48.89369965, 46.80500031, 48.87929916, 48.98075104, 40.8852005 , 48.85932922, 48.76292038]) - elev(site_id)float641.832e+03 3.246e+03 ... 1.073e+03
array([1831.84802246, 3246.12011719, 2255.52001953, 2258.56811523,
       1996.43994141, 1883.66394043, 1514.85595703, 1353.31201172,
       2257.34887695, 2724.91210938, 2392.67993164, 1490.4720459 ,
       2836.46875   , 3340.60791016, 3133.34399414, 2749.29589844,
       2846.83203125, 3133.34399414, 1862.32800293, 2369.51513672,
       2889.50390625, 2590.80004883, 2913.88793945, 1426.46398926,
        987.55200195, 2538.98388672, 2918.15527344, 2717.29199219,
       2816.35205078, 2443.58154297, 2608.17358398, 2477.71923828,
       2838.60229492, 1072.89599609, 2066.23925781, 2503.93188477,
       3493.00805664, 3541.77587891, 3054.09594727, 3267.45605469,
       2767.58398438, 2061.36230469, 2536.5456543 , 2548.12792969,
       1414.27197266, 1188.7199707 , 2081.78393555, 1645.92004395,
       1700.78405762, 1776.98400879, 1283.20800781, 2822.44799805,
       2621.2800293 ,  128.01600647, 1597.15197754, 2662.73291016,
       2520.69604492, 2971.49511719, 3212.59204102, 3081.52807617,
       3267.45605469,  652.27197266, 1930.90795898, 2316.47998047,
       1484.37597656,  762.        , 2395.72802734, 2709.67211914,
       2629.20483398, 1929.99365234, 2348.48388672, 2209.80004883,
       2579.82714844, 3119.62792969, 1853.7935791 , 2993.13598633,
       3206.49609375, 2240.2800293 , 2859.02392578, 3041.90405273,
...
       2170.17602539, 2407.91992188, 1716.02404785, 3352.80004883,
       2331.7199707 , 1816.60803223, 2103.12011719, 2545.08007812,
       2097.02392578, 1923.28796387, 2209.80004883,  984.50402832,
        890.01599121,  911.35198975, 2255.52001953, 2435.35205078,
       2139.69604492, 3287.26806641, 3048.        , 2161.94628906,
       2712.7199707 , 1066.80004883, 1228.34399414,  926.59197998,
       1161.28796387, 1008.88800049, 2816.35205078, 2941.01513672,
       2630.42407227, 2529.84008789, 1432.56005859, 1295.40002441,
       2316.47998047, 1868.4239502 , 2502.40795898, 3488.43603516,
       2956.56005859, 2042.16003418,  819.9119873 , 2901.69604492,
       2965.70410156,  685.79998779, 1996.43994141, 2194.56005859,
       2435.35205078, 1554.47998047, 2578.60791016, 3102.86401367,
       3340.60791016, 3230.87988281, 3230.87988281, 3398.52001953,
       3157.72802734, 2840.73608398,  963.16802979, 1271.01599121,
       1222.24804688, 2993.13598633, 1490.4720459 , 2325.62402344,
       3169.91992188, 2359.15209961, 2042.16003418, 1527.04797363,
       1197.86401367, 1575.81604004, 1932.43200684, 1499.6159668 ,
       1792.22399902, 1801.36804199, 3062.93530273, 1737.35998535,
       1219.19995117, 1536.1920166 , 1432.56005859, 1106.4239502 ,
        515.11199951, 2675.22949219, 1606.29602051, 1072.89599609])
- SNWD_D(time, site_id)float64nan nan nan nan ... nan nan nan nan
- description :
- SNOTEL snow depth measurements
- units :
- inches
array([[nan, nan, nan, ..., nan, nan, nan], [nan, nan, nan, ..., nan, nan, nan], [nan, nan, nan, ..., nan, nan, nan], ..., [nan, nan, nan, ..., nan, nan, nan], [nan, nan, nan, ..., nan, nan, nan], [nan, nan, nan, ..., nan, nan, nan]]) - WTEQ_D(time, site_id)float64nan nan nan nan ... 6.8 75.0 40.6
- units :
- inches w.e.
- description :
- SNOTEL snow water equivalent measurements
array([[ nan,  nan,  nan, ...,  nan,  nan,  nan],
       [ nan,  nan,  nan, ...,  nan,  nan,  nan],
       [ nan,  nan,  nan, ...,  nan,  nan,  nan],
       ...,
       [17. ,  7.3,  6. , ...,  6.8, 73.9, 39.2],
       [17.1,  7.4,  6. , ...,  6.8, 74. , 39.4],
       [17.2,  7.3,  6. , ...,  6.8, 75. , 40.6]])
Write out as NetCDF file
Better than random pickle file
out_fn = os.path.join(snotel_datadir, 'SNOTEL_CONUS_all.nc')
#ds.to_netcdf?
ds.to_netcdf(out_fn)
reopened = xr.open_dataset(out_fn)
reopened
<xarray.Dataset>
Dimensions:  (time: 21335, site_id: 808)
Coordinates:
  * time     (time) datetime64[ns] 1963-10-01 1963-10-02 ... 2022-02-27
  * site_id  (site_id) object 'SNOTEL:1000_OR_SNTL' ... 'SNOTEL:999_WA_SNTL'
    lon      (site_id) float64 -122.2 -105.4 -116.9 ... -110.8 -121.4 -121.7
    lat      (site_id) float64 42.87 37.61 40.36 46.91 ... 40.89 48.86 48.76
    elev     (site_id) float64 1.832e+03 3.246e+03 ... 1.606e+03 1.073e+03
Data variables:
    SNWD_D   (time, site_id) float64 ...
WTEQ_D (time, site_id) float64 ...- time: 21335
- site_id: 808
- time(time)datetime64[ns]1963-10-01 ... 2022-02-27
array(['1963-10-01T00:00:00.000000000', '1963-10-02T00:00:00.000000000', '1963-10-03T00:00:00.000000000', ..., '2022-02-25T00:00:00.000000000', '2022-02-26T00:00:00.000000000', '2022-02-27T00:00:00.000000000'], dtype='datetime64[ns]') - site_id(site_id)object'SNOTEL:1000_OR_SNTL' ... 'SNOTE...
array(['SNOTEL:1000_OR_SNTL', 'SNOTEL:1005_CO_SNTL', 'SNOTEL:1006_NV_SNTL', ..., 'SNOTEL:992_UT_SNTL', 'SNOTEL:998_WA_SNTL', 'SNOTEL:999_WA_SNTL'], dtype=object) - lon(site_id)float64...
array([-122.165176, -105.373268, -116.864922, ..., -110.827698, -121.43895 , -121.698227]) - lat(site_id)float64...
array([42.870071, 37.614971, 40.357571, ..., 40.885201, 48.859329, 48.76292 ])
- elev(site_id)float64...
array([1831.848022, 3246.120117, 2255.52002 , ..., 2675.229492, 1606.296021,
       1072.895996])
- SNWD_D(time, site_id)float64...
- description :
- SNOTEL snow depth measurements
- units :
- inches
[17238680 values with dtype=float64]
- WTEQ_D(time, site_id)float64...
- units :
- inches w.e.
- description :
- SNOTEL snow water equivalent measurements
[17238680 values with dtype=float64]
Isolate one site
sitecode = 'SNOTEL:679_WA_SNTL'
ds.sel(site_id=sitecode)
<xarray.Dataset>
Dimensions:  (time: 21335)
Coordinates:
  * time     (time) datetime64[ns] 1963-10-01 1963-10-02 ... 2022-02-27
    site_id  <U18 'SNOTEL:679_WA_SNTL'
    lon      float64 -121.7
    lat      float64 46.78
    elev     float64 1.564e+03
Data variables:
    SNWD_D   (time) float64 nan nan nan nan nan nan ... nan nan nan nan nan nan
WTEQ_D (time) float64 nan nan nan nan nan nan ... 51.1 51.2 51.3 51.4 52.0- time: 21335
- time(time)datetime64[ns]1963-10-01 ... 2022-02-27
array(['1963-10-01T00:00:00.000000000', '1963-10-02T00:00:00.000000000', '1963-10-03T00:00:00.000000000', ..., '2022-02-25T00:00:00.000000000', '2022-02-26T00:00:00.000000000', '2022-02-27T00:00:00.000000000'], dtype='datetime64[ns]') - site_id()<U18'SNOTEL:679_WA_SNTL'
array('SNOTEL:679_WA_SNTL', dtype='<U18') - lon()float64-121.7
array(-121.74765015)
- lat()float6446.78
array(46.78264999)
- elev()float641.564e+03
array(1563.62402344)
- SNWD_D(time)float64nan nan nan nan ... nan nan nan nan
- description :
- SNOTEL snow depth measurements
- units :
- inches
array([nan, nan, nan, ..., nan, nan, nan])
- WTEQ_D(time)float64nan nan nan nan ... 51.3 51.4 52.0
- units :
- inches w.e.
- description :
- SNOTEL snow water equivalent measurements
array([ nan, nan, nan, ..., 51.3, 51.4, 52. ])
#Doesn't work
#ds.sel(site_id=sitecode).plot()
ds.sel(site_id=sitecode).WTEQ_D
<xarray.DataArray 'WTEQ_D' (time: 21335)>
array([ nan,  nan,  nan, ..., 51.3, 51.4, 52. ])
Coordinates:
  * time     (time) datetime64[ns] 1963-10-01 1963-10-02 ... 2022-02-27
    site_id  <U18 'SNOTEL:679_WA_SNTL'
    lon      float64 -121.7
    lat      float64 46.78
    elev     float64 1.564e+03
Attributes:
    units:        inches w.e.
description: SNOTEL snow water equivalent measurements- time: 21335
- nan nan nan nan nan nan nan nan ... 50.0 50.9 51.1 51.2 51.3 51.4 52.0
array([ nan, nan, nan, ..., 51.3, 51.4, 52. ])
- time(time)datetime64[ns]1963-10-01 ... 2022-02-27
array(['1963-10-01T00:00:00.000000000', '1963-10-02T00:00:00.000000000', '1963-10-03T00:00:00.000000000', ..., '2022-02-25T00:00:00.000000000', '2022-02-26T00:00:00.000000000', '2022-02-27T00:00:00.000000000'], dtype='datetime64[ns]') - site_id()<U18'SNOTEL:679_WA_SNTL'
array('SNOTEL:679_WA_SNTL', dtype='<U18') - lon()float64-121.7
array(-121.74765015)
- lat()float6446.78
array(46.78264999)
- elev()float641.564e+03
array(1563.62402344)
- units :
- inches w.e.
- description :
- SNOTEL snow water equivalent measurements
ds.sel(site_id=sitecode).WTEQ_D.plot();
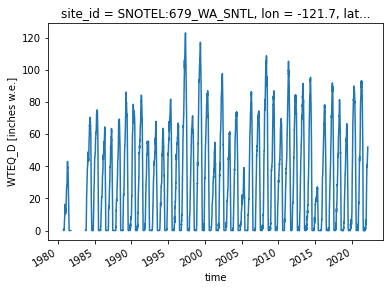
f, ax = plt.subplots()
ds.sel(site_id=sitecode).WTEQ_D.plot(ax=ax, label='WTEQ_D')
ds.sel(site_id=sitecode).SNWD_D.plot(ax=ax, label='SNWD_D')
ax.legend();
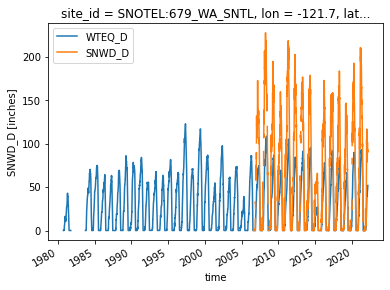
#Remember we used hvplot for pandas
#import hvplot.pandas
import hvplot.xarray
ds.sel(site_id=sitecode).hvplot()
ds.sel(site_id=sitecode).plot.scatter(x="SNWD_D", y="WTEQ_D", s=1, c=ds.isel(site_id=0)['time'])
<matplotlib.collections.PathCollection at 0x7f06c8f3d8e0>
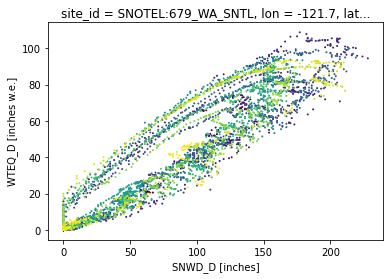
ds.plot.scatter(x="lon", y="lat", c=ds["elev"])
<matplotlib.collections.PathCollection at 0x7f06c9452610>